
H. Huang, Z. M. Zhang, B. Zhang, W. Hong, S. K. He, L. B. Meng, W. Qi, B. Cui, W. M. Zhou. Investigation of magnetic inhibition effect on ion acceleration at high laser intensities[J]. Matter and Radiation at Extremes, 2021, 6(4): 044401
- Matter and Radiation at Extremes
- Vol. 6, Issue 4, 044401 (2021)
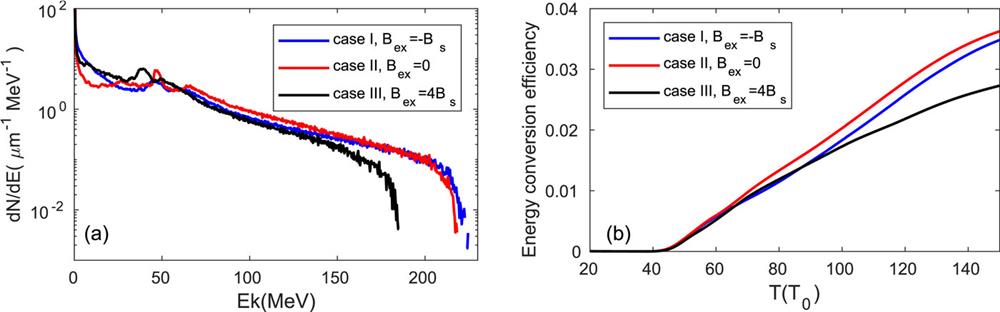
Fig. 1. (a) Proton energy spectra for cases I (blue), II (red), and III (black) at t = 100T 0 (T 0 is the laser period). (b) Laser-to-proton energy conversion efficiency as a function of simulation time.
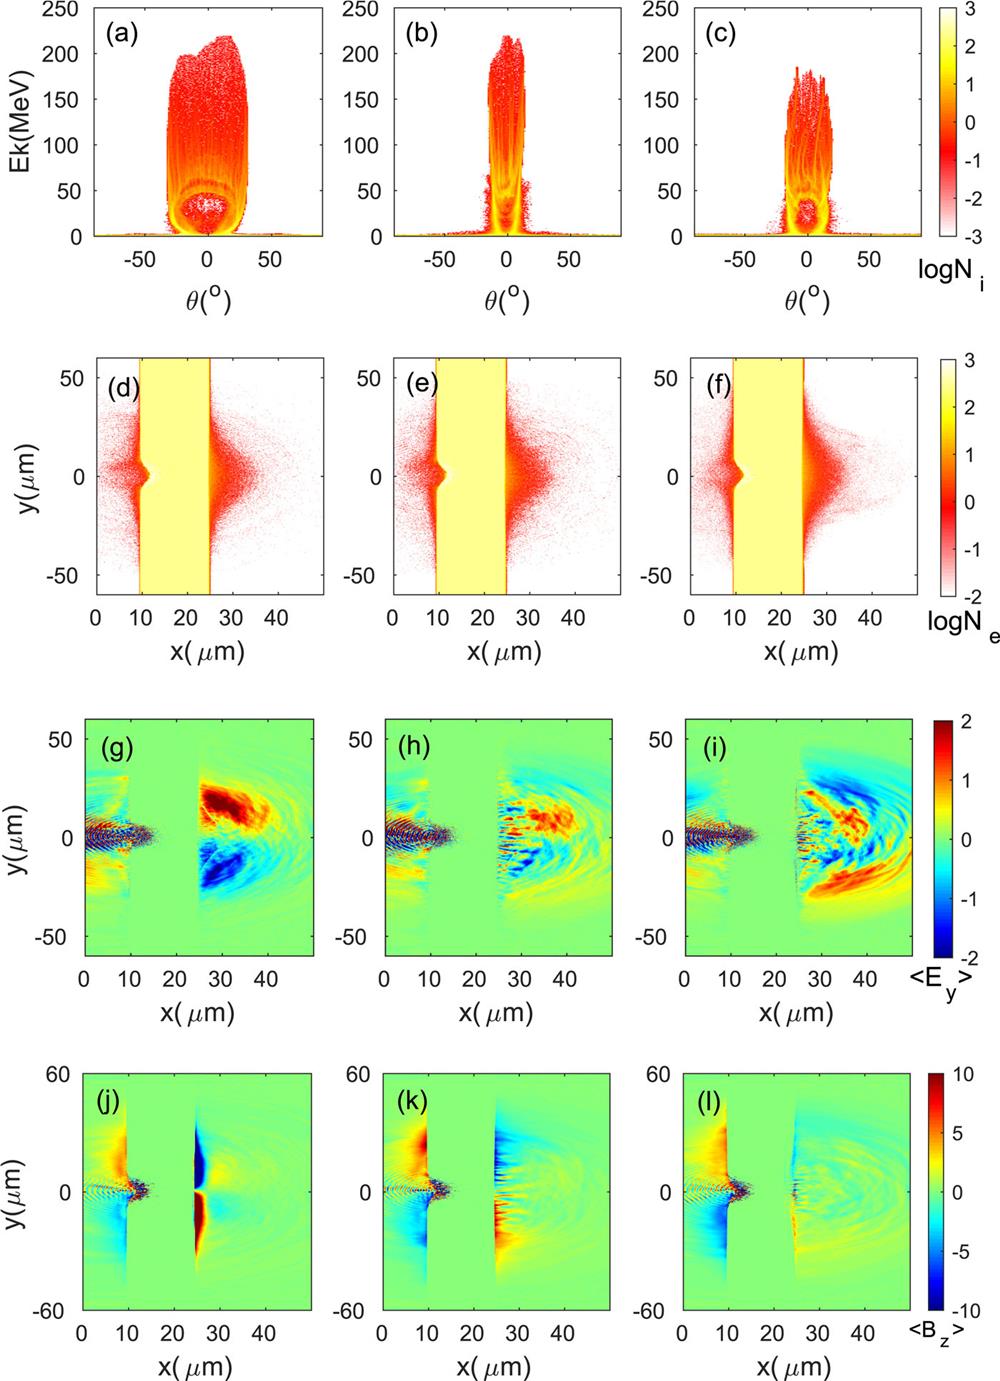
Fig. 2. (a)–(c) Proton angular distributions at t = 100T 0 for cases I–III, respectively. (d)–(f) Spatial distributions of electron density n e at t = 75T 0 for cases I–III, respectively. The corresponding spatial distributions of the averaged transverse electric field 〈E y 〉 and self-generated azimuthal B-field 〈B z 〉 are shown in (g)–(i) and (j)–(l), respectively. Here 〈 〉 denotes the average over one laser period T 0, e.g., 〈 E y 〉 = ( 1 / T 0 ) ∫ t − T 0 / 2 t + T 0 / 2 E y ( t ) d t y = 0 corresponds to the laser axis.
Fig. 3. Time-integrated spectra of (a) the forward and (b) the backward electrons as they pass by the boundaries placed at the target rear side (x = 26 µ m) at t = 75T 0.
Fig. 4. (a) and (b) Evolution of an on-axis proton initially located at (25.02, 60 µ m): (a) transverse position y ; (b) averaged longitudinal sheath field 〈E x 〉. (c) and (d) Evolution of an off-axis proton initially located at (25.02, 45 µ m): (c) transverse position y ; (d) averaged transverse sheath field 〈E y 〉. 〈 〉 denotes the average over one laser period. The line y = 0 corresponds to the laser axis.
Fig. 5. Maximum proton energy E i max E s max E i ∝ ( I λ 2 ) 0.71 E i ∝ ( I λ 2 ) 0.34 E s ∝ ( I λ 2 ) 0.4 E s ∝ ( I λ 2 ) 0.66


Set citation alerts for the article
Please enter your email address

© Copyright 2018-2021 | Chinese Laser Press. All Rights Reserved 沪ICP备15018463号-20