
Yuan Zhou, Dong-Yan Lü, Wei-You Zeng, "Chiral single-photon switch-assisted quantum logic gate with a nitrogen-vacancy center in a hybrid system," Photonics Res. 9, 405 (2021)
- Photonics Research
- Vol. 9, Issue 3, 405 (2021)
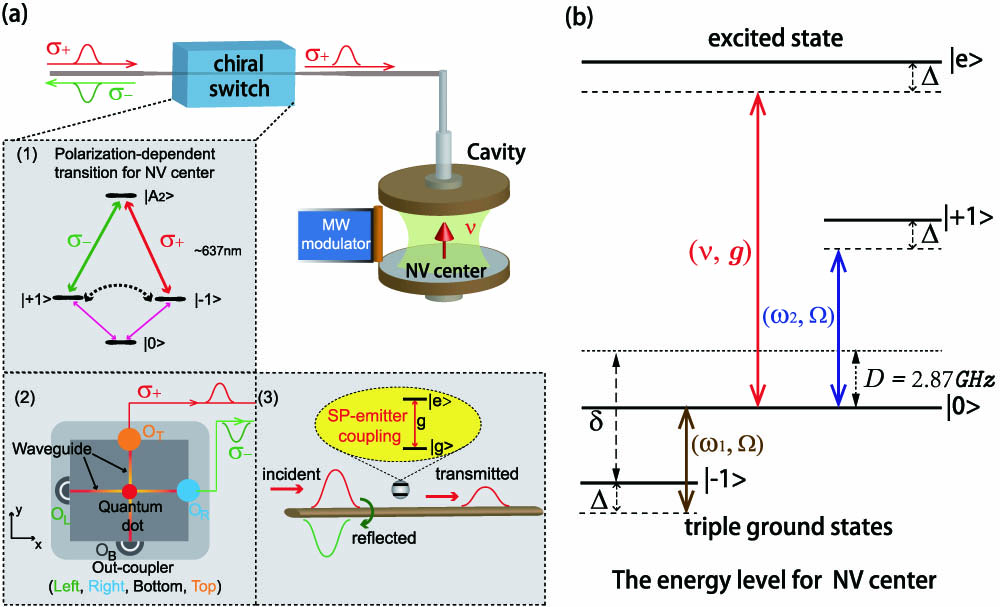
Fig. 1. Scheme diagrams. (a) This hybrid device consists of two parts, a chiral switch for emitting photon pulse and an optical microcavity embedded with a single NV center, both of which are connected with an optical nanofiber. The outputs are delivered to the optical microcavity through nanofiber. A single NV center, driven by a dichromatic microwave field, is planted in the optical microcavity, which will also interact with the optical modes near-resonantly. (b) Level diagram of the NV center ground triplet state and excited state, and the feasible transition channels. The brown and blue solid arrows indicate the dichromatic microwave driving fields (with frequencies ω 1 ω 2 Ω 1 Ω 2 | m s = 0 ⟩ | m s = ∓ 1 ⟩ | m s = 0 ⟩ | e ⟩ σ +
![For Case (I), the dynamical evolution of the fidelity, (a) and (b) with the initial state |1⟩p|−1⟩, and (c) and (d) with the initial state |1⟩p|+1⟩, in which (a) and (c) correspond to the dynamical fidelity versus the coupling strength g, with the coefficients g∈[5Ω,10Ω], Δ≃25Ω, κ≃0.1Ω, γe≃Ω, and γg≃0.001Ω; (b) and (d) correspond to the dynamical fidelity versus the detuning Δ, with the coefficients Δ∈[25Ω,50Ω], g=5Ω, κ≃0.1Ω, γe≃Ω, and γg≃0.001Ω.](/richHtml/prj/2021/9/3/03000405/img_002.jpg)
Fig. 2. For Case (I), the dynamical evolution of the fidelity, (a) and (b) with the initial state | 1 ⟩ p | − 1 ⟩ | 1 ⟩ p | + 1 ⟩ g g ∈ [ 5 Ω , 10 Ω ] Δ ≃ 25 Ω κ ≃ 0.1 Ω γ e ≃ Ω γ g ≃ 0.001 Ω Δ Δ ∈ [ 25 Ω , 50 Ω ] g = 5 Ω κ ≃ 0.1 Ω γ e ≃ Ω γ g ≃ 0.001 Ω
Fig. 3. For Case (II), the dynamical evolution of the fidelity, with the initial state | − 1 ⟩ Δ ≃ 25 Ω κ ≃ 0.1 Ω γ e ≃ Ω γ g ≃ 0.001 Ω | 0 ⟩ | − 1 ⟩ | + 1 ⟩
Fig. 4. For Case (I), (a) and (b) the dynamical fidelity of state transitions | 1 ⟩ p | ± 1 ⟩ → | 1 ⟩ p | ± 1 ⟩ δ Ω ∈ [ − 0.2 Ω , 0.2 Ω ] g ≃ 5 Ω Δ ≃ 25 Ω κ ≃ 0.1 Ω γ e ≃ Ω γ g ≃ 0.001 Ω | − 1 ⟩ | 0 ⟩ | − 1 ⟩ ↔ | + 1 ⟩ δ Ω ∈ [ − 0.2 Ω , 0.2 Ω ] Δ ≃ 25 Ω κ ≃ 0.1 Ω γ e ≃ Ω γ g ≃ 0.001 Ω
Fig. 5. The estimation of the average fidelity for this whole C-NOT operation process versus the dispersion rate δ Ω / Ω ∈ [ − 0.2, 0.2 ] ∼ 0.9 Δ ≃ 25 Ω κ ≃ 0.1 Ω γ e ≃ Ω γ g ≃ 0.001 Ω


Set citation alerts for the article
Please enter your email address

© Copyright 2018-2021 | Chinese Laser Press. All Rights Reserved 沪ICP备15018463号-20