• Journal of Semiconductors
  • Vol. 40, Issue 5, 052201 (2019)
Yan Gao1、2, Liyun Zhao2、3, Qiuyu Shang2、3, Chun Li2, Zhen Liu2, Qi Li1, Xina Wang1, and Qing Zhang2、3
Author Affiliations
  • 1Hubei Collaborative Innovation Center for Advanced Organic Chemical Materials, Hubei Key Laboratory of Ferro & Piezoelectric Materials and Devices, Faculty of Physics and Electronic Science, Hubei University, Wuhan 430062, China
  • 2Department of Materials Science and Engineering, College of Engineering, Peking University, Beijing 100871, China
  • 3Research Center for Wide Gap Semiconductor, Peking University, Beijing 100871, China
  • show less
    DOI: 10.1088/1674-4926/40/5/052201 Cite this Article
    Yan Gao, Liyun Zhao, Qiuyu Shang, Chun Li, Zhen Liu, Qi Li, Xina Wang, Qing Zhang. Photoluminescence properties of ultrathin CsPbCl3 nanowires on mica substrate[J]. Journal of Semiconductors, 2019, 40(5): 052201 Copy Citation Text show less
    (Color online) The structure and morphology characterization of ultrathin CsPbCl3 nanowires (NWs) epitaxial on mica. (a) Scanning electron microscopy (SEM) image of the ultrathin CsPbCl3 NWs grown on (001)-mica by chemical vapor deposition method. (b) Atomic force microscopy (AFM) image of the CsPbCl3 NWs, scale bar: 100 nm. (c) Corresponding data of CsPbCl3 NWs height extracted from (b). (d) X-ray diffraction pattern of the CsPbCl3 NWs on mica (red line) and mica (black line).
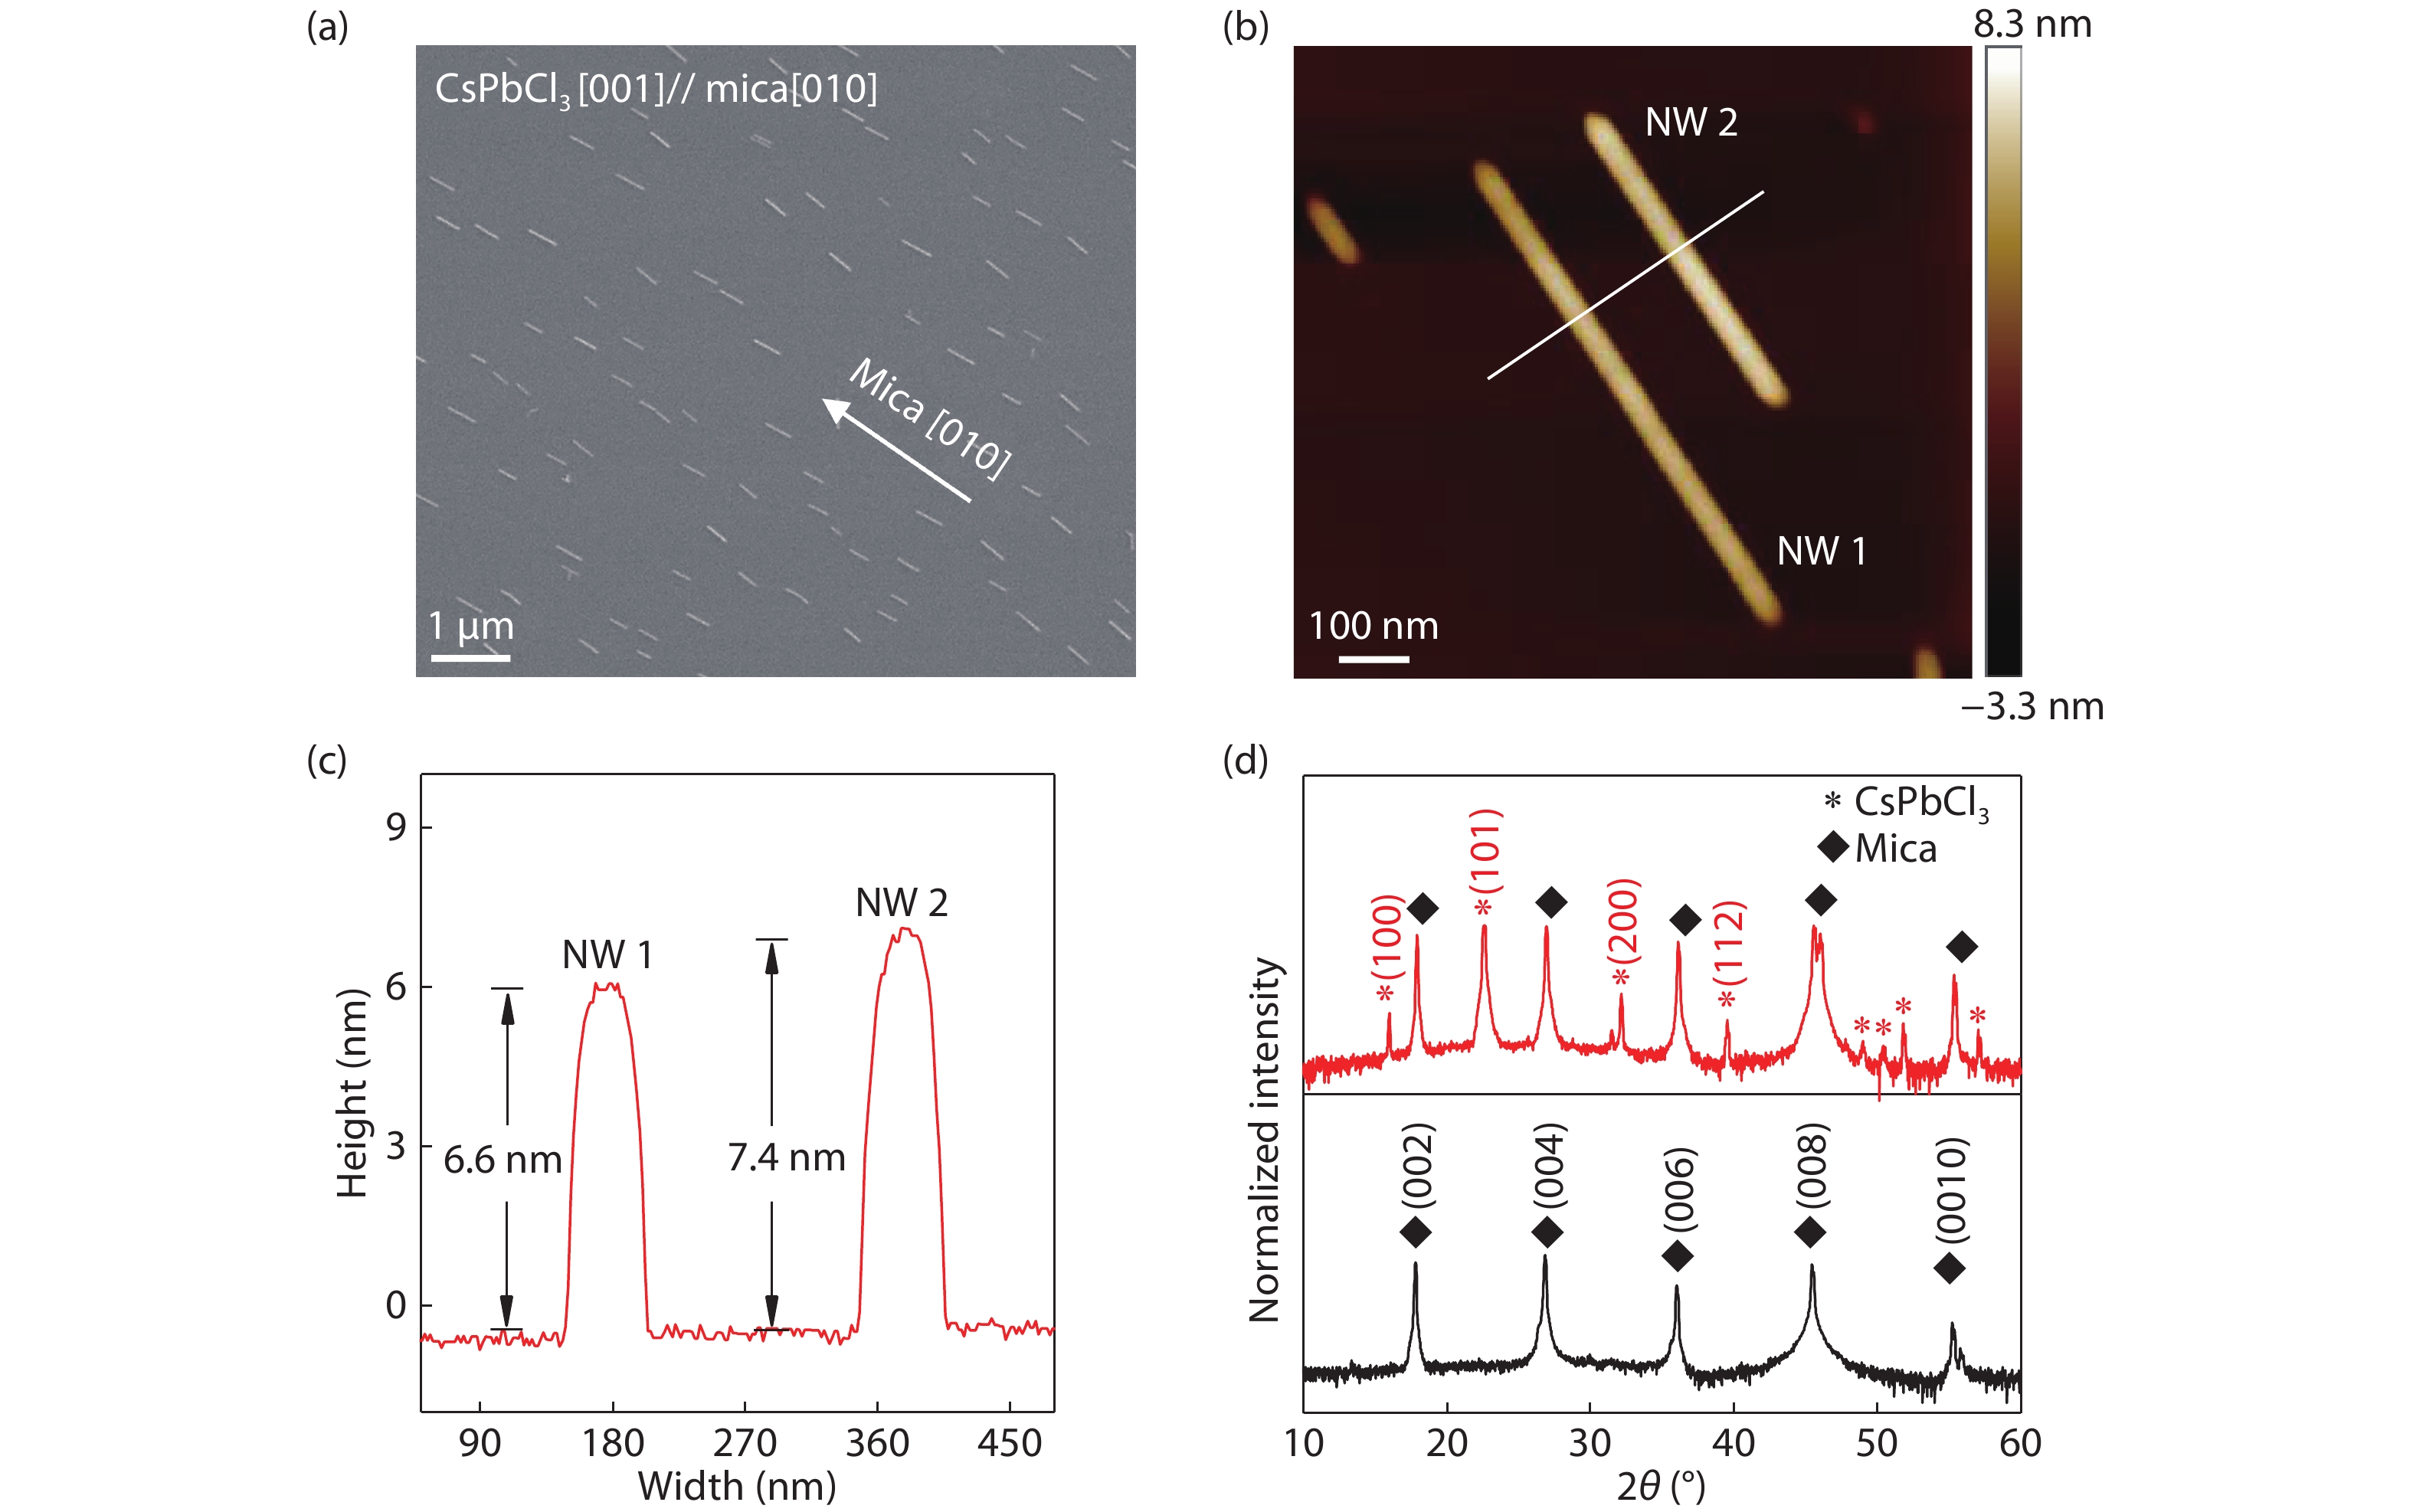
    Fig. 1. (Color online) The structure and morphology characterization of ultrathin CsPbCl3 nanowires (NWs) epitaxial on mica. (a) Scanning electron microscopy (SEM) image of the ultrathin CsPbCl3 NWs grown on (001)-mica by chemical vapor deposition method. (b) Atomic force microscopy (AFM) image of the CsPbCl3 NWs, scale bar: 100 nm. (c) Corresponding data of CsPbCl3 NWs height extracted from (b). (d) X-ray diffraction pattern of the CsPbCl3 NWs on mica (red line) and mica (black line).
    (Color online) Photoluminescence (PL) emission spectra of thin (height: ~ 7 nm; upper panel) and thick (height: ~ 8 μm; lower panel) CsPbCl3 NWs on mica at (a) 294 K and (b) 78 K, respectively. Solid and dashed lines: Lorentzian function fitting curves; open circles: experimental data. The excitation power density Pex of ~ 1.2 kW/cm2.
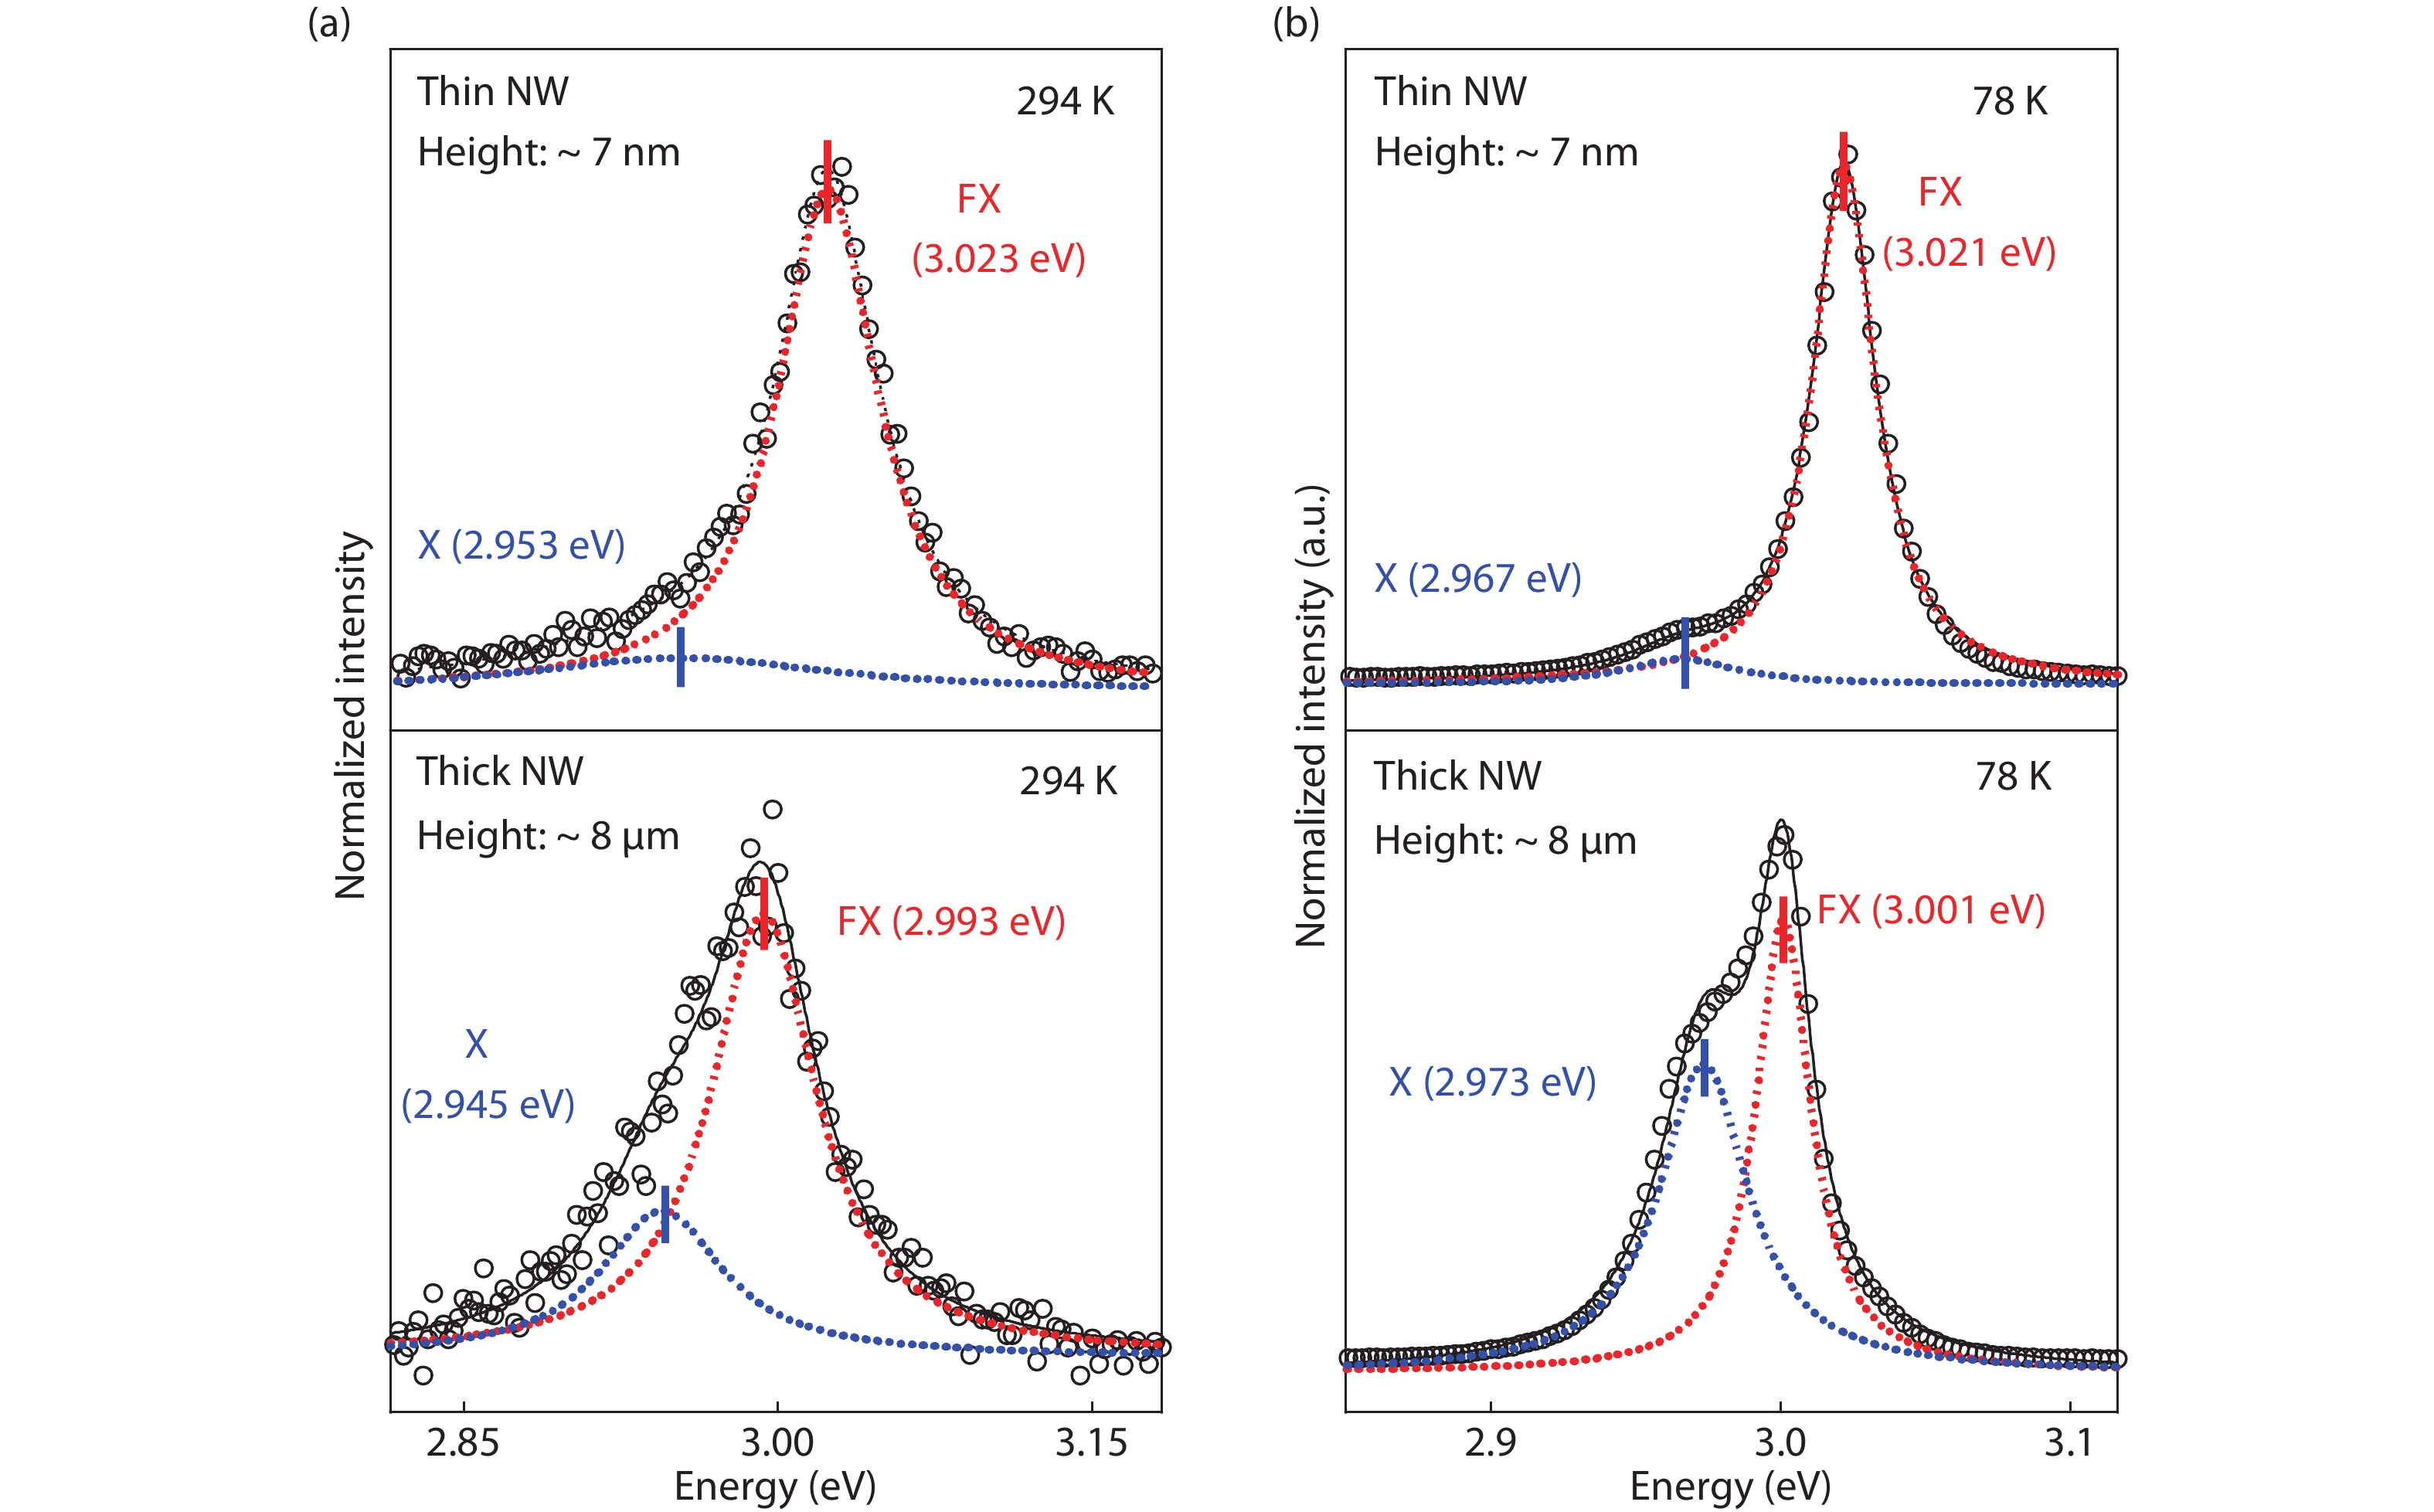
    Fig. 2. (Color online) Photoluminescence (PL) emission spectra of thin (height: ~ 7 nm; upper panel) and thick (height: ~ 8 μm; lower panel) CsPbCl3 NWs on mica at (a) 294 K and (b) 78 K, respectively. Solid and dashed lines: Lorentzian function fitting curves; open circles: experimental data. The excitation power density Pex of ~ 1.2 kW/cm2.
    (Color online) (a) Power-dependent emission spectra of thin CsPbCl3 NWs on mica at 294 K with Pex from ~ 0.3 to 61.1 kW/cm2. Scatters: experimental data points; red and blue dot lines are the fitting curves of the FX and X-band emission by Lorentzian function, respectively. (b) Integrated PL intensity as a function of Pex extracted from (a). Red scatters and blue scatters: integrated PL peak intensity of FX and X-band as a function of Pex, respectively; black scatters: the integrated PL intensity of NWs; solid lines: fitting curves.
    Fig. 3. (Color online) (a) Power-dependent emission spectra of thin CsPbCl3 NWs on mica at 294 K with Pex from ~ 0.3 to 61.1 kW/cm2. Scatters: experimental data points; red and blue dot lines are the fitting curves of the FX and X-band emission by Lorentzian function, respectively. (b) Integrated PL intensity as a function of Pex extracted from (a). Red scatters and blue scatters: integrated PL peak intensity of FX and X-band as a function of Pex, respectively; black scatters: the integrated PL intensity of NWs; solid lines: fitting curves.
    (Color online) (a) Temperature-dependent PL spectra of CsPbCl3 NWs on mica in the range of 294 − 78 K. The red and blue dot lines are the fitting curves of the FX and X-band by Lorentzian function, respectively. Scatters: experimental data point; Pex: ~ 1.2 kW/cm2. (b) Corresponding integrated PL intensity (blue scatters) and center peak energy (pink scatters) of FX as a function of temperature (solid red line, fitting curve). (c) FWHM of FX emission peak (blue scatters, experimental data points; red line, fitting curve). The Γin, ΓAC and ΓOC represent the contribution of inhomogeneous broadening, acoustic phonon and optical phonon for FWHM broaden. Solid line, Γin + ΓAC + ΓOC; dashed dot line, Γin + ΓOC; dot line, Γin + ΓAC. The fitting result show that the temperature-dependent FWHM broaden is mainly contributed from the optical phonon.
    Fig. 4. (Color online) (a) Temperature-dependent PL spectra of CsPbCl3 NWs on mica in the range of 294 − 78 K. The red and blue dot lines are the fitting curves of the FX and X-band by Lorentzian function, respectively. Scatters: experimental data point; Pex: ~ 1.2 kW/cm2. (b) Corresponding integrated PL intensity (blue scatters) and center peak energy (pink scatters) of FX as a function of temperature (solid red line, fitting curve). (c) FWHM of FX emission peak (blue scatters, experimental data points; red line, fitting curve). The Γin, ΓAC and ΓOC represent the contribution of inhomogeneous broadening, acoustic phonon and optical phonon for FWHM broaden. Solid line, Γin + ΓAC + ΓOC; dashed dot line, Γin + ΓOC; dot line, Γin + ΓAC. The fitting result show that the temperature-dependent FWHM broaden is mainly contributed from the optical phonon.
    Yan Gao, Liyun Zhao, Qiuyu Shang, Chun Li, Zhen Liu, Qi Li, Xina Wang, Qing Zhang. Photoluminescence properties of ultrathin CsPbCl3 nanowires on mica substrate[J]. Journal of Semiconductors, 2019, 40(5): 052201
    Download Citation