
Meng-qi LÜ, Yu-jie SONG, Hai-yong WENG, Da-wei SUN, Xiao-ya DONG, Hui FANG, Hai-yan CEN. Effect of Near Infrared Hyperspectral Imaging Scanning Speed on Prediction of Water Content in Arabidopsis[J]. Spectroscopy and Spectral Analysis, 2020, 40(11): 3508
- Spectroscopy and Spectral Analysis
- Vol. 40, Issue 11, 3508 (2020)
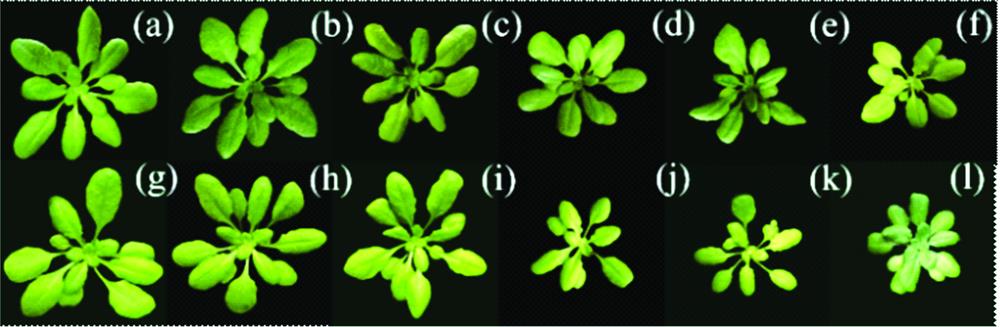
Fig. 1. RGB images of Arabidopsis phenotypes
(a)—(f): Col-0 ecotype on 0~5 days of drought stress;(g)—(l): OSCA1 mutant genotypes on 0~5 days of drought stress
(a)—(f): Col-0 ecotype on 0~5 days of drought stress;(g)—(l): OSCA1 mutant genotypes on 0~5 days of drought stress
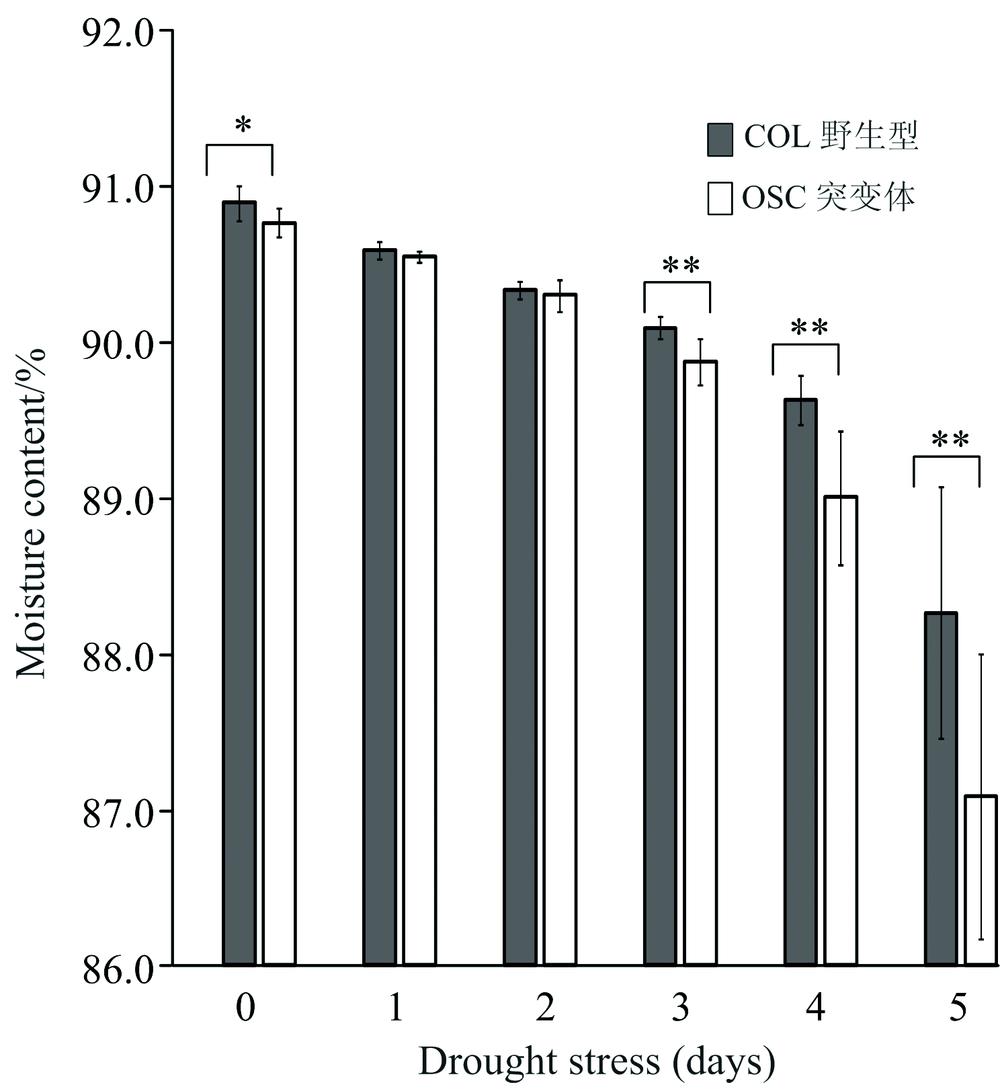
Fig. 2. The relationship between water content of Arabidopsis thaliana and the number of days post drought stress
Gray color represents Col-1 and white color represents OSCA1; Changes are represented by the mean±standard deviation; * and ** represent the degree of significant differences based on Duncan test (* represents 0.03<p <0.05; ** represents 0.01<p <0.03)
Gray color represents Col-1 and white color represents OSCA1; Changes are represented by the mean±standard deviation; * and ** represent the degree of significant differences based on Duncan test (* represents 0.03<
Fig. 3. Mean spectra of all Arabidopsis canopy (20 mm·s-1)
Fig. 4. PLSR model results for different moving speeds with full spectra
(a): 20 mm·s-1; (b): 30 mm·s-1; (c): 40 mm·s-1
(a): 20 mm·s-1; (b): 30 mm·s-1; (c): 40 mm·s-1
Fig. 5. The variation of spatial resolution caused by different scanning speed
(a): 20 mm·s-1; (b): 30 mm·s-1; (c): 40 mm·s-1
(a): 20 mm·s-1; (b): 30 mm·s-1; (c): 40 mm·s-1
Fig. 6. The performance of PLSR models of different scanning speed based on optimal wavelengths
(a): 20 mm·s-1; (b): 30 mm·s-1; (c): 40 mm·s-1
(a): 20 mm·s-1; (b): 30 mm·s-1; (c): 40 mm·s-1
|
Table 1. The performance of PLSR model based on different spectral pretreatment methods (20 mm·s-1)
|
Table 2. The summary of optimal wavelengths based on Successive projection algorithm (SPA)


Set citation alerts for the article
Please enter your email address

© Copyright 2018-2021 | Chinese Laser Press. All Rights Reserved 沪ICP备15018463号-20