
Chen Zhenwei, Meng Yichao, Zhan Yaomu. Maximum Sampling Rate of Chaotic Random Signals Generated By Optoelectronic Oscillator[J]. Laser & Optoelectronics Progress, 2021, 58(3): 3070011
- Laser & Optoelectronics Progress
- Vol. 58, Issue 3, 3070011 (2021)
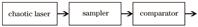
Fig. 1. Block diagram of random number generation by chaotic laser
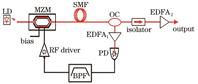
Fig. 2. Schematic diagram of photoelectric oscillation chaotic system
Fig. 3. Schematic diagram of all-optical sampling system
Fig. 4. Outputs of photoelectric oscillating chaotic system. (a) Time series; (b) autocorrelation function; (c) power spectrum; (d) sampled signal for 100 GSa·s-1 sampling rate
Fig. 5. Change in probability of run test
Fig. 6. Autocorrelation functions of signal for different sampling rates. (a) Sampling rate is 1.33 GSa·s-1; (b) sampling rate is 46.33 GSa·s-1; (c) sampling rate is 47.33 GSa·s-1; (d) sampling rate is 100.33 GSa·s-1
Fig. 7. Power spectra of discrete sampling signals. (a) Sampling rate is 100 GSa·s-1; (b) sampling rate is 46.33 GSa·s-1; (c) sampling rate is 15.78 GSa·s-1; (d) fitting curves of power spectra under different sampling rates
Fig. 8. Frequency distribution histograms of signal amplitude. (a) Sampling rate is 1.33 GSa·s-1; (b) sampling rate is 3.33 GSa·s-1; (c) sampling rate is 40.33 GSa·s-1; (d) sampling rate is 50.33 GSa·s-1
Fig. 9. Change of probability of normality test with sampling rate
Fig. 10. Change of Lyapunov exponent with
Fig. 11. Change of
Fig. 12. Evolution of probability density function with
Fig. 13. Change of

Set citation alerts for the article
Please enter your email address
© Copyright 2018-2021 | Chinese Laser Press. All Rights Reserved 沪ICP备15018463号-20