• Infrared and Laser Engineering
  • Vol. 50, Issue 4, 20190565 (2021)
Yun Zhang, Bowen Liu, Huanyu Song, Yuan Li, Lu Chai, and Minglie Hu
Author Affiliations
  • Ultrafast Laser Laboratory, College of Precision Instruments and Opto-Electronics Engineering, Tianjin University, Tianjin 300072, China
  • show less
    DOI: 10.3788/IRLA20190565 Cite this Article
    Yun Zhang, Bowen Liu, Huanyu Song, Yuan Li, Lu Chai, Minglie Hu. Effects of gain distribution on self-similar amplification of picosecond pulses[J]. Infrared and Laser Engineering, 2021, 50(4): 20190565 Copy Citation Text show less
    Self-similar amplification in different pump schemes. (a) Forward pump, (b) backward pump
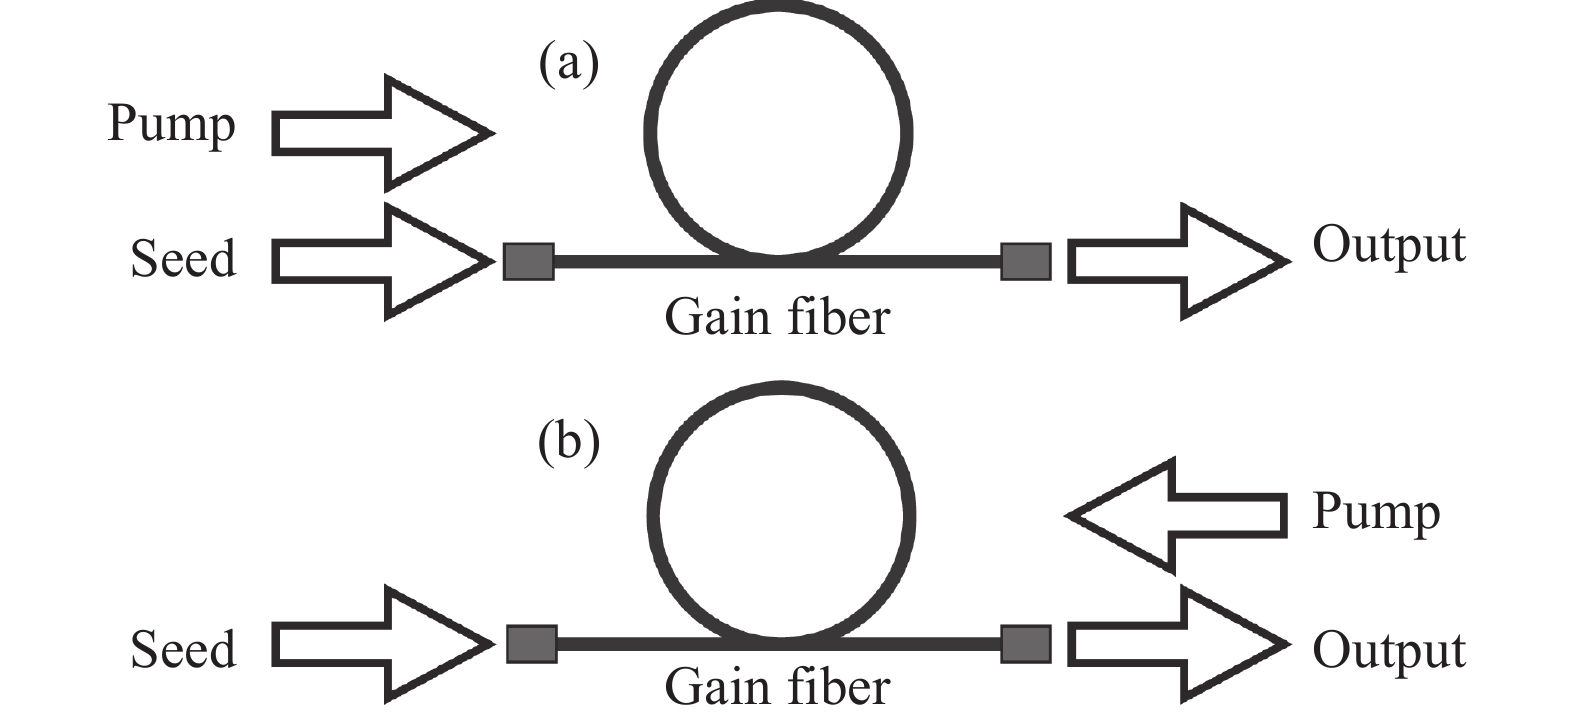
    Fig. 1. Self-similar amplification in different pump schemes. (a) Forward pump, (b) backward pump
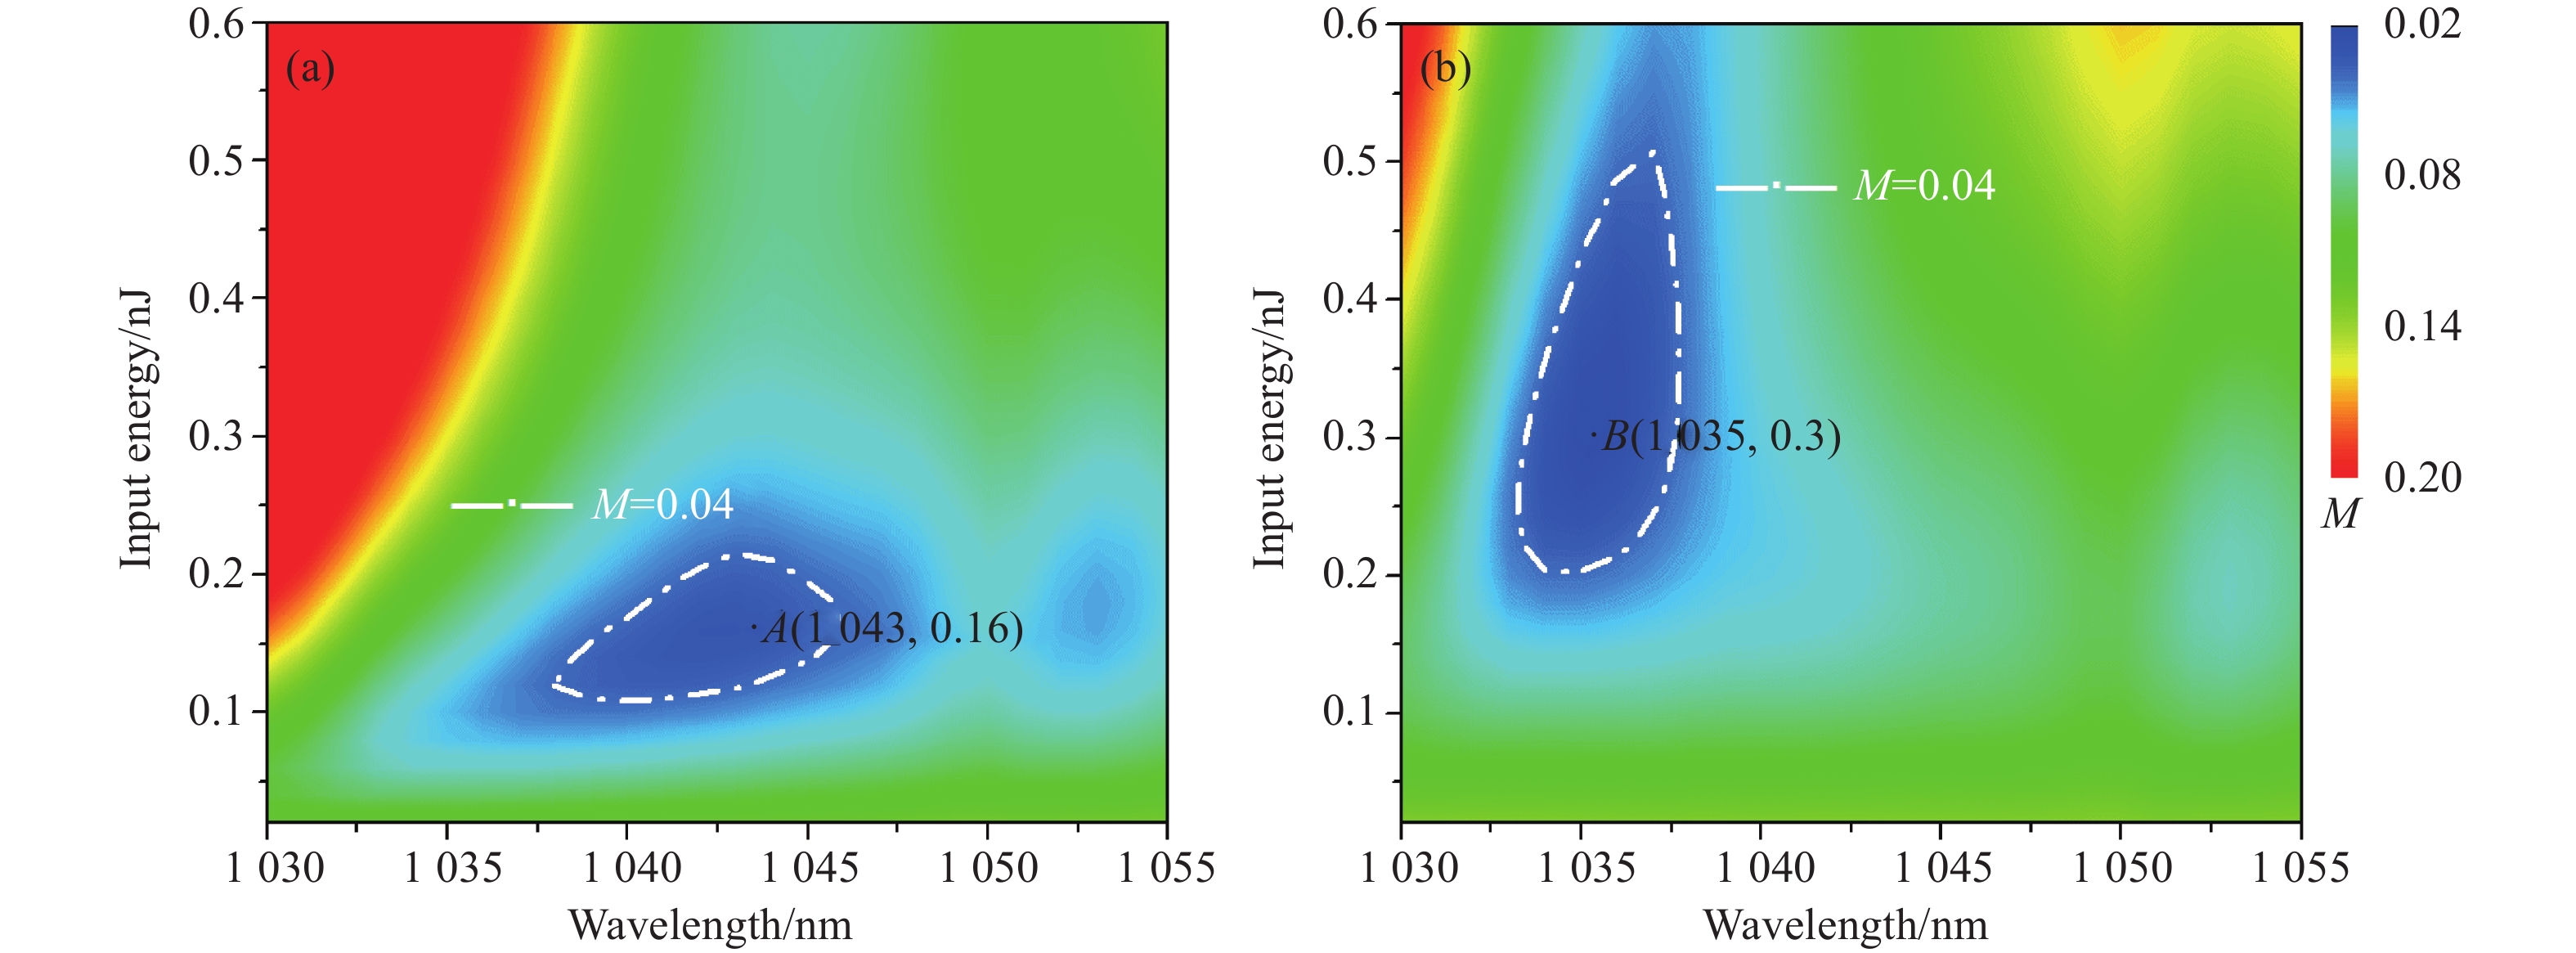
    M-factors versus pulse central wavelength and input energy of amplified pulses in different pump schemes. (a) Forward pump, (b) backward pump. Point A and B represent the minimum value of M-factors in (a) and (b), which are the best points of self-similar evolution
    Fig. 2. M-factors versus pulse central wavelength and input energy of amplified pulses in different pump schemes. (a) Forward pump, (b) backward pump. Point A and B represent the minimum value of M-factors in (a) and (b), which are the best points of self-similar evolution
    Amplification results of seed pulses in different pump schemes. (a) De-chirped pulse profile of the seed pulse of point A transmitting to the end of the 2 m-long fiber in forward-pumping scheme, (b) de-chirped pulse profile of the seed pulse of point B transmitting to the end of the 2 m-long fiber in backward-pumping scheme. Black lines and red lines are seed pulses and transform-limited pulses. Insets: corresponding spectra (left) and amplified pulses before compression (right). Black lines and red lines are seed pulses and parabolic fittings
    Fig. 3. Amplification results of seed pulses in different pump schemes. (a) De-chirped pulse profile of the seed pulse of point A transmitting to the end of the 2 m-long fiber in forward-pumping scheme, (b) de-chirped pulse profile of the seed pulse of point B transmitting to the end of the 2 m-long fiber in backward-pumping scheme. Black lines and red lines are seed pulses and transform-limited pulses. Insets: corresponding spectra (left) and amplified pulses before compression (right). Black lines and red lines are seed pulses and parabolic fittings
    Evolution of the seed pulse of point A in forward-pumping and backward-pumping schemes. (a) Peak power (solid) and M-factor (dash-dot), (b) 10 dB spectral width (solid) and pulse width(dash-dot). Black lines and red lines represent forward pump and backward pump. (c) Spectral evolution in forward-pumping scheme, (d) Spectral evolution in backward-pumping scheme
    Fig. 4. Evolution of the seed pulse of point A in forward-pumping and backward-pumping schemes. (a) Peak power (solid) and M-factor (dash-dot), (b) 10 dB spectral width (solid) and pulse width(dash-dot). Black lines and red lines represent forward pump and backward pump. (c) Spectral evolution in forward-pumping scheme, (d) Spectral evolution in backward-pumping scheme
    Evolution of the seed pulse of point B in forward-pumping and backward-pumping schemes. (a) Peak power (solid) and M-factor(dash-dot), (b) 10 dB spectral width (solid) and pulse width(dash-dot). Black lines and red lines represent forward pump and backward pump. (c) Spectral evolution in forward-pumping scheme, (d) Spectral evolution in backward-pumping scheme
    Fig. 5. Evolution of the seed pulse of point B in forward-pumping and backward-pumping schemes. (a) Peak power (solid) and M-factor(dash-dot), (b) 10 dB spectral width (solid) and pulse width(dash-dot). Black lines and red lines represent forward pump and backward pump. (c) Spectral evolution in forward-pumping scheme, (d) Spectral evolution in backward-pumping scheme
    M-factors versus central wavelength and input energy of amplified pulses in different pump schemes with different fiber lengths. In forward-pumping scheme, the M-factors of amplified pulses with the fiber length of (a) 2 m, (b) 3 m, (c) 4 m. In backward-pumping scheme, the M-factors of amplified pulses with the fiber length of (d) 2 m, (e) 3 m, (f) 4 m
    Fig. 6. M-factors versus central wavelength and input energy of amplified pulses in different pump schemes with different fiber lengths. In forward-pumping scheme, the M-factors of amplified pulses with the fiber length of (a) 2 m, (b) 3 m, (c) 4 m. In backward-pumping scheme, the M-factors of amplified pulses with the fiber length of (d) 2 m, (e) 3 m, (f) 4 m
    M-factors versus central wavelength and input energy of amplified pulses in different pump schemes with different total gain coefficients. In forward-pumping scheme, the M-factors of amplified pulses with the total gain coefficient of (a) 20 dB, (b) 25 dB, (c) 30 dB. In backward-pumping scheme, the M-factors of amplified pulses with the total gain coefficient of (d) 20 dB, (e) 25 dB, (f) 30 dB
    Fig. 7. M-factors versus central wavelength and input energy of amplified pulses in different pump schemes with different total gain coefficients. In forward-pumping scheme, the M-factors of amplified pulses with the total gain coefficient of (a) 20 dB, (b) 25 dB, (c) 30 dB. In backward-pumping scheme, the M-factors of amplified pulses with the total gain coefficient of (d) 20 dB, (e) 25 dB, (f) 30 dB
    ParameterValueParameterValue
    c/m•s−13×108h/J•s 6.63×10⁻³⁴
    Ap/m23.14×10−8As/m21.256×10−9
    β2/ps2•m−10.023γ/W−1 m−12.14×10⁻⁴
    τ/ms 0.8n2/W−1 m22.3×10−20
    NYb/m−33.8×10−25λp/nm 976
    σa(λ)/m2Ref. [18] σe(λ)/m2Ref. [18]
    Table 1. [in Chinese]
    Yun Zhang, Bowen Liu, Huanyu Song, Yuan Li, Lu Chai, Minglie Hu. Effects of gain distribution on self-similar amplification of picosecond pulses[J]. Infrared and Laser Engineering, 2021, 50(4): 20190565
    Download Citation