C. E. Garcia-Ortiz1,*, R. Cortes1, J. E. Gómez-Correa1, E. Pisano1,2..., J. Fiutowski3, D. A. Garcia-Ortiz4, V. Ruiz-Cortes5, H.-G. Rubahn3 and V. Coello1|Show fewer author(s)
C. E. Garcia-Ortiz, R. Cortes, J. E. Gómez-Correa, E. Pisano, J. Fiutowski, D. A. Garcia-Ortiz, V. Ruiz-Cortes, H.-G. Rubahn, V. Coello, "Plasmonic metasurface Luneburg lens," Photonics Res. 7, 1112 (2019)
Copy Citation Text
We present a new design of a plasmonic Luneburg lens made from a gradient-index metasurface that was constructed with an array of nanometer-sized holes in a dielectric thin film. The fabricated structure consists of a planar lens with a diameter of 8.7 μm composed of a rectangular array of holes with a periodicity of 300 nm. The experimental characterization includes leakage-radiation microscopy imaging in the direction and frequency space. The former allows for characterization of the point spread function and phase distribution, whereas the latter grants access to qualitative measurements of the effective mode indices inside the plasmonic lens. The experimental results presented here are in good agreement with the expected average performance predicted by the numerical calculations. Nevertheless, the robustness of the characterization techniques presented here is also exploited to determine deviations from the design parameters.
1. INTRODUCTION
Transformation optics (TO) offers the possibility to create new optical components with predesigned functionalities. Essentially, it consists of an alternative way to control the propagation of light by means of a spatial variation, based on coordinate transformations, that can be obtained by modifying the local permittivity and permeability of the material where light propagates [1,2]. The recent advances in the development of new metasurfaces and metamaterials, i.e., artificial materials with unique optical properties that are not present naturally [2], have boosted the search of novel optical devices based on TO. The first reported device based on TO consisted of a two-dimensional cylinder that worked as an invisibility cloak in the microwave regime [3]. Many others followed this approach and led to the design of interesting optical devices such as wave concentrators [4], rotators [5], perfect lenses [6], optical wormholes [7], and wavefront modulators [8], among others.
Gradient refractive index (GRIN) lenses are also considered as TO-based optical devices [9], where the Maxwell fish-eye lens [10], the Eaton lens [11], and the Luneburg lens [12] are well-known examples of such devices. Here, we focus on the properties of the Luneburg lens. It belongs to a family of lenses that are free of spherical aberrations and are constituted of spherical refractive-index iso-surfaces. The Luneburg lens has astigmatic properties, such as the ability to converge in a single focal point all the incident light waves coming from a single point source. The best-known solution of the Luneburg lens, due to its mathematical simplicity, focuses the incident plane waves on the surface of the spherical lens opposite to the incidence side. Recently, several geometric transformations to the spherical Luneburg lens have been proposed without affecting its unique properties. For instance, the Luneburg lens has been used as an alternative to model the GRIN structure of the human crystalline lens in two [13] and three dimensions [14] and as a practical slim antenna [15].
An advantage of GRIN optics consists of their scalability towards two dimensions. Several designs of Luneburg lenses have been proposed in previous works and demonstrated to work with different types of surface waves [16–19] including surface-plasmon polaritons (SPPs) [20]. SPPs are electromagnetic surface waves associated with a collective oscillation of electrons that propagate along the interface between a metal and a dielectric [21]. A considerable amount of micro- and nano-optical devices have been designed to operate with SPPs, such as plasmonic waveguides [22,23], nano-lenses [24], and nano-antennas [25], among others. In the last decade, the research on plasmonic lenses has received growing attention due to their capability to confine strong electromagnetic fields in subwavelength regions, mostly because of its applications in high-resolution imaging, biological and chemical sensing, surface-enhanced Raman spectroscopy (SERS), and as a fundamental tool for the study of other plasmonic devices [26]. There are several designs of plasmonic lenses that can be found in the literature, which include focusing devices based on diffractive slit patterns [27], metallic circular ridges [24], circular arrays of holes [28], and coaxial structures [29], among others [30–33].
Sign up for Photonics Research TOC. Get the latest issue of Photonics Research delivered right to you!Sign up now
In this work, we present a new design of a plasmonic metasurface Luneburg lens (PMLL) constructed with an array of nanometer-sized holes in a dielectric material. The proposed design is relatively simple to fabricate with state-of-the-art electron-beam lithography (EBL) equipment, and it does not require additional modules, e.g., grey-scale EBL [20]. The performance of the lens was characterized using leakage-radiation microscopy (LRM) in the image and Fourier planes at a wavelength . Furthermore, the phase distribution of the SPPs that propagate and interact with the PMLL was experimentally determined using interference-fringe analysis. The main advantage of this plasmonic lens, in comparison with the other mentioned plasmonic lenses, is their capability to control and redirect the energy flux after the focal point, making it possible to redirect or re-collimate SPPs with other plasmonic devices.
2. MATERIALS AND METHODS
A. Fabrication and Design
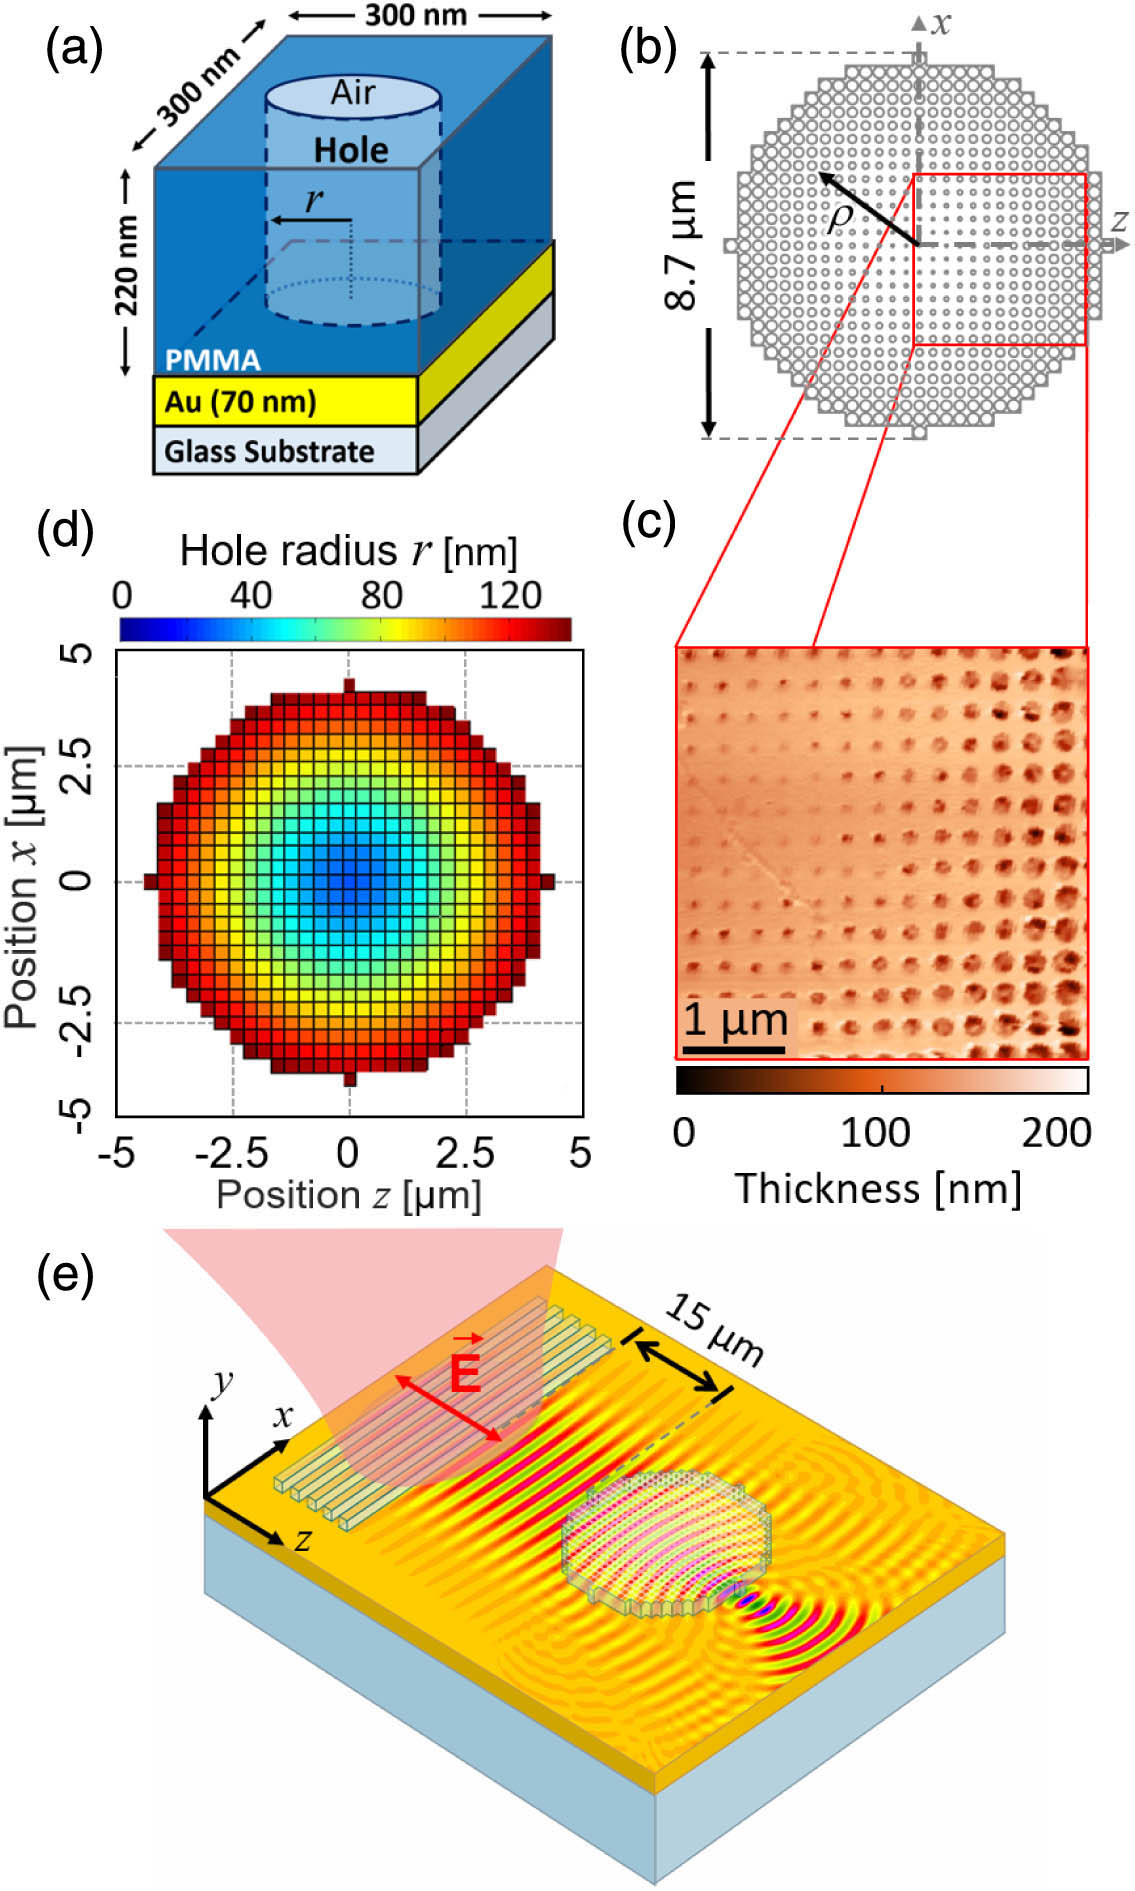
The PMLL was fabricated using EBL and subsequent lift-off. The lithographic resist consisted of polymethyl methacrylate (PMMA), which has a bulk refractive index of for [34]. The structures were fabricated over a 70-nm-thick gold film that was evaporated on top of a glass substrate () using electron-beam physical vapor deposition. The elementary unit cell consists of a area composed of the multilayer system glass/gold/PMMA/air, with a cylindrical hole in the PMMA film. The thickness of the PMMA was set to 220 nm, and the radii of the holes, , varied depending on the relative position from the center of the PMLL [Figs. 1(a)–1(d)]. In principle, the size of the unit cells must be much smaller than the operation wavelength; nevertheless, the resolution limit of the available EBL system () determines the size for the smallest holes. For these reasons, we chose the lateral dimension of the unit cell to be (), which satisfies the Luneburg relation of effective refractive indices for a starting radius of at the origin ().
Figure 1.Schematic diagrams of (a) the elementary unit cell that conforms the PMLL and (b) the whole PMLL structure. (c) High-resolution atomic-force microscopy image of a μμ area taken on top of the PMLL. (d) Radii size distribution of every elementary unit cell. (e) Schematic diagram (not at scale) showing the PMLL and the grating used to excite the SPPs, which propagate in the direction. The red double arrow indicates the polarization of the laser.
The complete planar lens structure consisted of a rectangular array of unit cells arranged in a quasi-circular distribution with a diameter of 8.7 μm [Fig. 1(b)]. The size of the holes gradually increased in the radial direction , which in turn decreased the local permittivity of the material. To excite SPPs, a dielectric (PMMA) grating was added to the design 15 μm apart from the PMLL [Fig. 1(e)]. Dielectric coupling gratings are excellent components to couple free-propagating light into SPPs due to their high coupling efficiencies that can reach up to 50% [35]. The grating used here has a period of 936 nm and a 50:50 filling factor. The period of the grating was set to be equal to the wavelength of the SPPs that propagate along the gold/air interface.
B. Luneburg Lens Analytical Description
A Luneburg lens has the characteristic of focusing plane waves in a diametrically opposite point from the incident wave on the rim of the lens, if the refractive index follows the relation where is the radial coordinate relative to the center of the lens, is the propagation direction, and is the radius of the Luneburg lens. One can notice that the range of is limited from 1 to . Equation (1) must also be satisfied for the real part of the local plasmonic effective-mode index, which in turn is a function of . The volume of the holes introduces a variation of the effective mode index, which relates the effective index with the volume fraction, and is described by [36]Here corresponds to the volume fraction of the holes, is the length of the unit cell, is the effective mode index of SPPs in the gold/PMMA/air multilayer (without the hole), and is the effective mode index of SPPs in the gold/air interface. The values and were obtained numerically by solving the wave equation of the multilayered system for the transverse-magnetic (TM) case [37] and by varying the thickness of the PMMA film to find a solution that approaches . In this way, a PMMA thickness of 220 nm was found and set [Fig. 2(d)]. Finally, to find an expression for , we require the real part of the local effective-mode index of the plasmonic metasurface to be equal to the Luneburg refractive index relation . Thus, combining Eqs. (1) and (2), we obtain
Figure 2.(a) Designed and analytical values of the local effective-mode index as a function of the relative position , where corresponds to the center of the PMLL, and μ corresponds to the difference between the limit of the physical lens (blue) and the Luneburg radius RL (red). (b) and (c) Calculated values of the (b) real and (c) imaginary parts of the designed local effective-mode index. (d) Dependence of the effective mode index of SPPs in the multilayer system for different values of the PMMA thickness. (e) Optical losses in the PMLL at each point of the structure.
For this work, we designed a PMLL with a radius μ; however, since the volume of the cylindrical hole cannot equal the volume of the unit cell, the physical limits of the designed PMLL do not coincide with . In this case, the difference was μ [Fig. 2(a)]. The real and imaginary parts of the effective mode index were calculated for each of the unit cells [Figs. 2(b) and 2(c)]. From , it was possible to calculate the minimum wavelength of the SPP mode , which can be found at the center (origin) of the PMLL. Similarly, the losses of the PMLL can be derived from the imaginary part of , giving a minimum value of 17 dB/mm near the perimeter of the lens, and the highest loss of 20 dB/mm at the center [Fig. 2(e)]. The performance of the PMLL was validated using the beam propagation method (BPM). First, the continuum case of a 2D (ideal) Luneburg lens was simulated to be compared with the discrete (real) case [Figs. 3(a) and 3(b)]. The results are in good agreement with previous works. For the discrete case of the designed PMLL, the field and intensity distributions were also calculated, and the results showed that the lens was also able to focus the incident wave in the posterior end of the lens [Figs. 3(d) and 3(e)], thus validating the use of the proposed discretization. The full width at half-maximum (FWHM) of both intensity cross sections was measured at the position , which corresponds to the position where the focus is expected. The resulting values of FWHMs were 0.55 and 0.60 μm for the continuum and discrete cases, respectively [Figs. 3(c) and 3(f)]. As expected, the discrete case showed a broader focus, and the focal distance was found after the physical limits of the lens [Fig. 3(e)].
Figure 3.The calculated (a) field and (b) intensity distributions of SPPs propagating along and passing through an ideal 2D Luneburg lens (continuum case). The red circles indicate the radius of the Luneburg lens. (c) Transverse cross section of the intensity profile at the point . The calculated (d) field and (e) intensity distributions of SPPs propagating through the designed PMLL (discrete case). The physical limits of the lens are delimited with black contours. (f) Transverse cross section showing the FWHM at the point .
The performance of the PMLL was characterized using LRM imaging [38] (see Appendix A). The images taken at the image plane correspond to the point spread function of the SPPs propagating in the metal/air interface and through the PMLL. The images showed focusing of the SPP beam near the edge of the lens opposite to the incidence side [Fig. 4(a)]. The SPP beam focuses at μ from the limits of the PMLL, which is slightly off () from the expected position . The relatively small difference can be explained by the fact that even small deviations from the designed values of the radii of the holes modify the characteristics of the PMLL. As explained before, the size distribution of the holes is very close to the resolution limit. Another important factor is attributed to LRM image focusing. It is generally a difficult task in LRM to determine the exact position of the focal point during experiments, mainly because the intensity distribution is in principle unknown, and it gets considerably distorted with small deviations from the focus [38]. The Luneburg lens requires symmetrical illumination, i.e., the incident wave must be aligned to the radial axis of the lens. When the SPP beam was aligned to the radial axis, the propagation was symmetrical, and the expected evolution of the beam was observed [Fig. 4(a)]. Although, when the SPP beam was misaligned of the radial axis, by displacing the beam a distance μ and μ from the axis, the intensity distributions change, and only a fraction of the PMLL interacts with the beam, causing the beam to bend (at angles ) in the direction towards the theoretical focal point [Figs. 4(b) and 4(c)]. This effect could be exploited to be used in micro- and nano-optical devices that required light to be focused at the same point independently of the alignment.
Figure 4.(a) LRM image of the SPP intensity distribution as it passes through the PMLL with symmetrical illumination conditions with respect to the radial axis. The inset corresponds to the intensity profile cross section at the focal point. (b) and (c) LRM images of the SPP intensity distributions with asymmetrical illumination. The dashed white circles correspond to the PMLL theoretical radius μ. The asymmetric illumination is produced by displacing the beam a distance (b) μ and (c) μ from the radial axis.
In contrast with the numerical calculations performed with the BPM, the experimental point spread function exhibited a wider spot in the focus with an FWHM of μ in the transverse direction. The widening could be related to a smaller effective numerical aperture of the fabricated lens, caused by an overestimation of the effective refractive index of the multilayer system. Changes of the PMMA thickness modify the overall properties of the local effective mode index and therefore of the lens [Fig. 2(d)]. In this case, the sensitivity of the effective index as a function of the PMMA thickness is . One way to solve the broadening of the focus could be the use of a thicker PMMA layer to increase the value of and the effective numerical aperture.
It was possible to fully experimentally characterize the effective refractive indices of the PMLL by means of Fourier plane image analysis [39]. Fourier plane grants access to the wave vector space, which can be further used to estimate the effective refractive indices if we consider the relation , where is the local wave vector of the SPP mode. In this case, we have a discrete and variable distribution of inside the PMLL, which appeared as a sequence of bright crescents in the Fourier plane [Fig. 5(a)]. An intensity cross section of the normalized wave vector , along , showed 10 peaks that correspond to different values of effective refractive indices of the PMLL [Fig. 5(b)]. Table 1 summarizes the measured values of in the direction of propagation. Nevertheless, one must think of these results as a histogram of the average refractive indices in the PMLL and not as independent local refractive indices of individual unit cells. This is the first time, to our knowledge, that a GRIN metasurface has been characterized to determine the distribution of the effective-mode indices.
Figure 5.(a) LRM cropped image of the Fourier plane. The origin is located in the center of the bright spot to the left of the image. (b) Intensity cross section along for . Each peak corresponds to different values of the effective mode indices supported in the PMLL.
A modified LRM illumination scheme (see Appendix A) was used to make the leakage radiation of the SPP mode interfere with the reference beam to get an image composed of interference fringes [Fig. 6(a)]. The bending of the wavefronts is clearly seen in the interference image as it propagates through the PMLL as well as the divergence after the focus. The interference image was then processed to determine the phase distribution of the SPP mode [Fig. 6(b)] (see Appendix B). Neither the illumination scheme used to produce the interference images nor the algorithm to recover the phase distribution has been reported previously. Moreover, the experimental determination of the phase distribution complements the characterization of this device, as it is possible to directly visualize the frequency changes in the PMLL. The experimental images were compared with the calculated values simulated for a plane wave using the BPM [Fig. 6(c)]. The experimental results are in good agreement with the prediction but with the difference that the focus, in the real case, occurs after the expected location. Another interesting feature corresponds to the curvature of the wavefronts inside the PMLL. The experimental phase distribution showed that the fabricated PMLL has a larger depth of focus than expected, if compared to our numerical calculations. As commented before, this effect corresponds to a difference of the real effective index in the PMLL. In this case, the effective indices have lower values than the design parameters. The same can also be directly deduced from the Fourier image analysis (Table 1). Such mismatches can easily be corrected changing the starting hole radius or by selecting a thicker PMMA film.
Figure 6.(a) LRM interference pattern of the SPPs that propagate and interact with the PMLL and interfere with a reference beam. (b) Measured phase distribution obtained from the interference pattern in (a). (c) Calculated amplitude of a plane wave interacting with the designed PMLL simulated with the BPM.
In summary, it was demonstrated that a plasmonic metasurface based on subwavelength holes in a dielectric thin film can be used to construct two-dimensional plasmonic GRIN optical devices such as the plasmonic Luneburg lens. Moreover, the LRM image analysis in the Fourier plane proved to be a simple yet powerful tool towards a complete characterization of two-dimensional GRIN devices due to the possibility to qualitatively determine the distribution of effective refractive indices. Additionally, the interference-pattern image analysis complemented the experimental characterization, as it was possible to visualize the wavefront evolution, frequency changes, and more importantly, to measure the phase distribution of the SPPs as they propagate and interact with the PMLL. This set of experimental techniques allows for a more complete and precise characterization of plasmonic GRIN devices, as it provides more tools to quantitatively determine the optical response and quality of the fabricated structures.
Acknowledgment
Acknowledgment. C.E.G.-O. and V.R.-C thank Aldo Peña Ramírez for his assistance in performing the experiments.
APPENDIX A: MODIFIED LRM ILLUMINATION SCHEME
The propagation of SPPs through the PMLL and the focusing effect were characterized using LRM in the image and Fourier planes [40]. The images taken at the image plane were used to visualize the power distribution and focusing of the SPPs as they interact with the two-dimensional PMLL, whereas the images collected at the Fourier plane gave information of the gradient and values of the effective refractive indices supported by the PMLL. For both cases, the LRM experimental setup was operating with the usual configuration: a laser beam with a Gaussian profile was weakly focused (μ) onto the grating using a objective to excite the SPPs. With this coupling technique, the profile and phase of the source are transferred to the SPP mode and thus generate a plasmonic Gaussian beam [41]. The leakage radiation was collected using a oil-immersion objective (MO) with a high numerical aperture , and the images were obtained using charge-coupled device (CCD) cameras at each plane [Fig. 7(a)]. A beam blocker (BB) is used near the Fourier plane to filter the directly transmitted light.
Figure 7.(a) LRM setup with an illumination scheme that focuses the excitation beam onto the grating to generate SPPs. (b) Modified experimental setup, which illuminates the whole area of interest to generate interference patterns in the image plane. The incident light acts as a reference beam and interferes with the leakage radiation (LR) of the excited SPPs generated with the grating. The schematic diagram shows how the LR recombines with the reference beam to generate the interference pattern in the image plane.
A modified illumination scheme of the LRM setup was used to monitor the evolution of the SPP wavefronts as they propagated through the PMLL and to estimate the local values of the SPP phase distribution. This process is usually performed by dividing the beam before excitation and further recombination to generate an interference pattern that can be analyzed to recreate the phase distribution [42]. Here we present a new alternative that requires less optical elements and alignment. The technique consists of illuminating the whole area of interest. The width of the beam should cover the excitation element (grating) and the plasmonic device of interest [Fig. 7(b)]. Diffraction gratings are very efficient elements to couple free-propagating light to SPPs; for that reason, it is possible to excite SPPs with enough power to generate an interference pattern with reasonably good contrast (root mean square contrast ~). Even though the PMLL can generate SPPs itself, it was clear from the images that such a process was very inefficient (lower contrast) compared with the SPPs generated with the diffraction grating.
APPENDIX B: PHASE DISTRIBUTION FROM THE INTERFERENCE FRINGE PATTERN
The phase distribution was obtained from the interference fringe pattern produced by the reference beam and the leakage radiation of SPPs. The process to estimate the phase distribution is as follows. First, the image must be filtered using a two-dimensional Fourier filter to remove the background (DC component). Second, horizontal rows of pixels from the interference pattern image are extracted from the complete image to be analyzed individually [Fig. 8(a)]. The average value must be subtracted from the signal to get values that oscillate around zero. At this stage, the phase distribution cannot be recovered directly from the intensity values because of fluctuations in the intensity as the SPPs propagate. The next step consists of finding a function, through numerical fitting, that represents the shape of the envelopes. It is important to calculate two envelopes: one for the positive values and another for the negative values. This can be done by creating a fit based on spline interpolation to the maximum and minimum values of the signal [Fig. 8(b)]. The final step consists of the normalization of the signal. The positive values must be normalized to the positive envelope fit, and vice versa; this way, the signal is normalized (stretched) to their respective local maximum values [Fig. 8(c)]. Finally, the normalized values are multiplied by a factor of to get the phase distribution. This process is repeated for every row in the image so that it is possible to reconstruct the two-dimensional phase distribution.
Figure 8.(a) Pixel intensity values for a row of pixels along the propagation direction. (b) Average-subtracted intensity values. The dashed lines correspond to the numerical fit to the maximum and minimum values. (c) Normalized signal and corresponding SPP phase.
[9] Q. Wu, J. P. Turpin, X. Wang, D. H. Werner, A. Pogrebnyakov, A. Swisher, T. S. Mayer. Flat transformation optics graded-index (TO-GRIN) lenses. 6th European Conference on Antennas and Propagation (EUCAP)(2012).
C. E. Garcia-Ortiz, R. Cortes, J. E. Gómez-Correa, E. Pisano, J. Fiutowski, D. A. Garcia-Ortiz, V. Ruiz-Cortes, H.-G. Rubahn, V. Coello, "Plasmonic metasurface Luneburg lens," Photonics Res. 7, 1112 (2019)