
Luca Zanotto, Riccardo Piccoli, Junliang Dong, Roberto Morandotti, Luca Razzari. Single-pixel terahertz imaging: a review[J]. Opto-Electronic Advances, 2020, 3(9): 200012-1
- Opto-Electronic Advances
- Vol. 3, Issue 9, 200012-1 (2020)
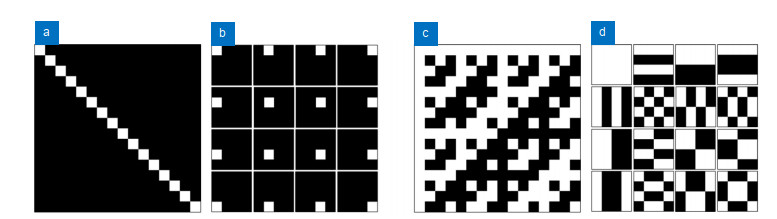
Fig. 1. (a ) 16 × 16 identity matrix H b ) the corresponding series of 16 (n 2), 4 × 4 spatial masks {Hi (x , y )}i =1…16 obtained from it; (c ) 16 × 16 Hadamard matrix H d ) corresponding set of 16, 4 × 4 spatial masks {Hi (x , y )}i =1…16.
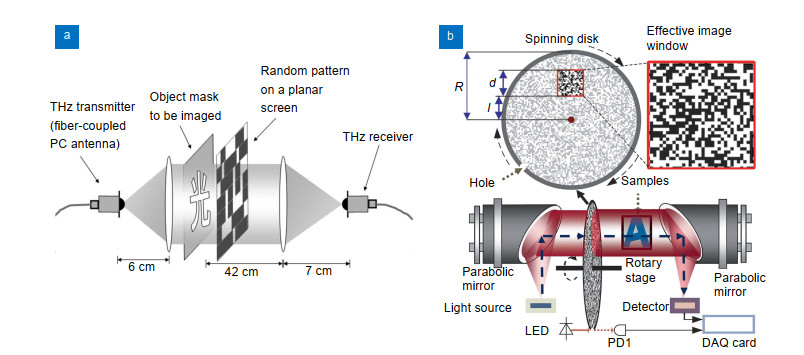
Fig. 2. (a ) Single-pixel imaging system based on metallic binary masks for THz modulation43. (b ) Spinning-disk based THz imaging setup. Figure reproduced from: (a) ref.43, AIP Publishing; (b) ref.44, Optical Society of America.
Fig. 3. All-optical modulation of a THz beam.
The patterning pump beam (visible/infrared) is modulated by an SLM. Subsequently, it illuminates the surface of a silicon plate and generates photo-carriers which transfer the pattern to the THz beam. Figure reproduced from ref.52, Optical Society of America.
Fig. 4. Metamaterial-based SLM55.
(a ) Operating principle of the SLM: THz light directly hits the SLM and the reflected beam results shaped into the spatial patterns. (b ) Photograph of the SLM. (c ) Map of the differential absorption for a +1/-1 Hadamard mask. (d ) Absorption of the MMA cell for two different bias conditions (0 V and 15 V). As can be seen, amplitude and frequency of the absorption peak are different. (e ) Differential absorption as a function of frequency. Figure reproduced from ref.55, Springer Nature Limited.
Fig. 5. (a ) Experimental setup exploiting the patterning of the probe beam for THz imaging57. The spatial shape of the pattern is encoded via an SLM on an optical beam, which is used to probe the collimated THz beam in the detection crystal. (b ) Experimental implementation of TNGI58. In this case, the pump beam generating THz radiation is spatially modulated, allowing to obtain a THz beam already shaped into the required masks. Figure reproduced from: (a) ref.57, Creative Common 4.0 International License; (b) ref.58, American Chemical Society.
Fig. 6. (a ) THz spectra of polyethylene (upper trace) and lactose (lower) and photo of the sample (polyethylene at the upper-left side, lactose at the bottom-right and copper in the rest of the surface61.(b ) Spectral images of the sample shown in the inset of (a ): the images (left to right) are reconstructed considering the absorption at 0.50 THz, 0.54 THz, 1.38 THz, respectively, while the last is an RGB map of the regions with different absorption features (lactose in red, polyethylene in green, copper in blue). The maps were obtained by Fourier-transforming the THz waveforms measured for each spatial pattern and then reconstructing the spectral amplitude in each pixel for the 3 frequencies of interest. (c ) Time-domain reconstruction of THz waveforms62: On the left side, the waveforms recorded for some of patterns; on the right side, those reconstructed in some selected pixels. (d ) HDPE sample used in Ref.62. (e ) 3D image of the sample in (d ), retrieved using the relative time delays of the THz pulses at each pixel, showing three different thicknesses. Figure reproduced from: (a, b) ref.61, AIP Publishing; (c–e) ref.62, Optical Society of America.
Fig. 7. (a1–f1 ) THz near-field imaging of a metallic cartwheel64. The images present the comparison between the experimental results and numerical modeling, for silicon modulators with decreasing thickness (400 µm (a1), (d1), 110 µm (b1), (e1), 6 µm (c1), (f1)). As can be clearly seen, only the 6 µm -thick silicon wafer allows to resolve the central region with smaller features. (a2 –j2 ) Hyperspectral image of a leaf 59: (a2 ) Optical image of the leaf; (b2 ) microscope image; (c2 ) temporal waveform of the THz field transmitted through the leaf; (d2 ) fixed-time reconstruction (128 × 128 -pixels); (e2 ) local temporal response of the fresh leaf in the points indicated in (b2); (f2 ) hyperspectral image of a fresh leaf at 1.5 THz (16 × 16 -pixels); (g2 ) phase image of the fresh leaf, obtained without phase unwrapping of the experimental data; (h2–j2 ) same as the previous panel for a dried leaf (32 × 32 -pixels image). All the images correspond to a field of view of 4 mm×4 mm. Figure reproduced from: (a1–f1) ref.64, The Optical Society; (a2–j2) ref.59, Optical Society of America.
Fig. 8. (a –d ) Tomographic reconstruction of a rectangular object68: two measured projections under a rotation angle of (a) 180° and (b) 120° (c) Ray tracing simulation for a rectangular object with edge lengths of 14 mm× 7 mm and a refractive index of 1.5 under a rotation of 120°. Red colored rays indicate rays which get totally reflected on the rear side, while green rays can pass through the object. (d) Measured sinogram of a cuboid polypropylene sample with edge lengths of 14 mm× 7 mm. (e ) Schematic of the GHOSTEAM system71: the spintronic THz emitter array (STEA) is excited by two-DMDs-encoded fs-laser pulses and generates spatially coded THz pulses. An object is placed in the near-field region (z < < λ ). The transmitted THz pulse is collected and sent to a single-pixel detector. Figure reproduced from: (a–d) ref.68, Optical Society of America; (e) ref.71, Creative Common 4.0 International License.


Set citation alerts for the article
Please enter your email address

© Copyright 2018-2021 | Chinese Laser Press. All Rights Reserved 沪ICP备15018463号-20