
Chunjian Hua, Jinhua Guo, Ying Chen. Image Segmentation for Mobile Phone Film Defects Under Low Contrast[J]. Laser & Optoelectronics Progress, 2020, 57(20): 201013
- Laser & Optoelectronics Progress
- Vol. 57, Issue 20, 201013 (2020)
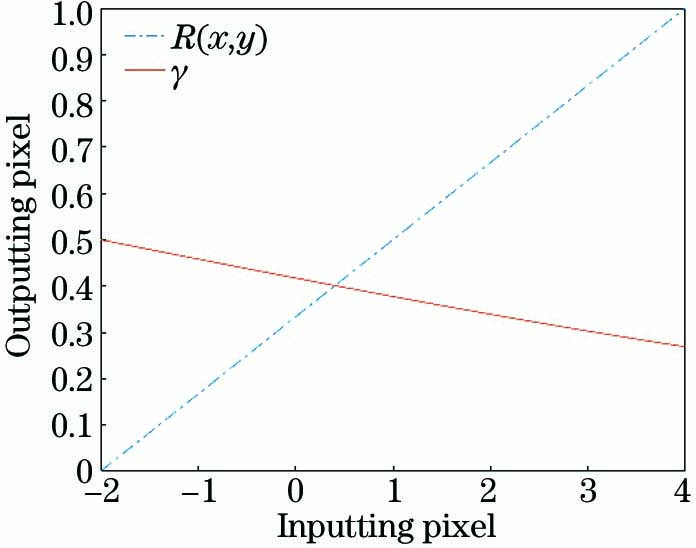
Fig. 1. Relation between the base number R(x, y) and the index γ in Gamma function
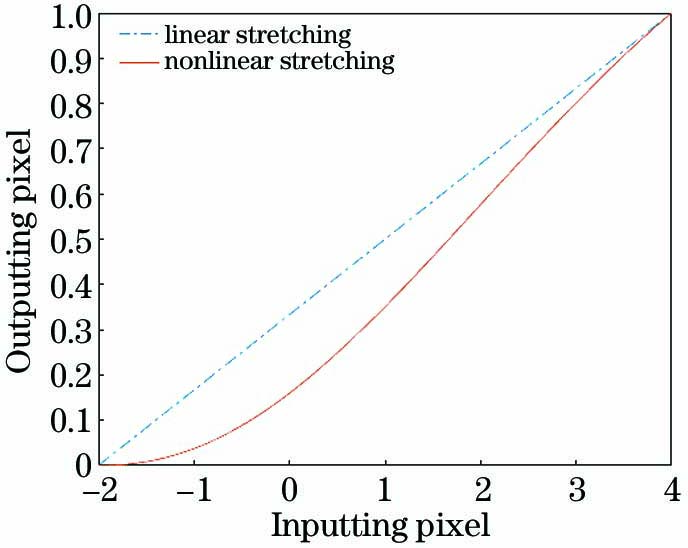
Fig. 2. Comparison of two stretching methods
Fig. 3. Comparison of the enhancement effect for scratch 1. (a) SSR; (b) algorithm in Ref.[4]; (c) CLAHE; (d) our algorithm
Fig. 4. Comparison of the enhancement effect for scratch 2. (a) SSR; (b) algorithm in Ref.[4]; (c) CLAHE; (d) our algorithm
Fig. 5. Comparison of the enhancement effect for scratch 3. (a) SSR; (b) algorithm in Ref.[4]; (c) CLAHE; (d) our algorithm
Fig. 6. Comparison of the enhancement effect for crease 1. (a) SSR; (b) algorithm in Ref.[4]; (c) CLAHE; (d) our algorithm
Fig. 7. Comparison of the enhancement effect for crease 2. (a) SSR; (b) algorithm in Ref.[4]; (c) CLAHE; (d) our algorithm
Fig. 8. Marked results graphs. (a) Defect enhancement image; (b) gradient image; (c) marked image
Fig. 9. Segmentation results of OTSU. (a) Fig. 3 ; (b) Fig. 4 ; (c) Fig. 5 ; (d) Fig. 6 ; (e) Fig. 7
Fig. 10. Segmentation results of our algorithm. (a) Fig. 3 ; (b) Fig. 4 ; (c) Fig. 5 ; (d) Fig. 6 ; (e) Fig. 7
|
Table 1. Comparison results of contrast of different algorithms
|
Table 2. Comparison results of information entropy of different algorithms
|
Table 3. Comparison of time-consuming of different algorithms unit: s

Set citation alerts for the article
Please enter your email address
© Copyright 2018-2021 | Chinese Laser Press. All Rights Reserved 沪ICP备15018463号-20