• Chinese Optics Letters
  • Vol. 20, Issue 9, 091201 (2022)
Yunlong Zhu1、2, Zhuoran Li1、2, Xu Lu1、2, Yonggui Yuan1、2、*, and Jun Yang2、3、4、**
Author Affiliations
  • 1Key Laboratory of In-fiber Integrated Optics, Ministry of Education of China, Harbin Engineering University, Harbin 150001, China
  • 2College of Physics and Optoelectronic Engineering, Harbin Engineering University, Harbin 150001, China
  • 3Guangdong Provincial Key Laboratory of Information Photonics Technology (Guangdong University of Technology), Guangzhou 510006, China
  • 4School of Information Engineering, Guangdong University of Technology, Guangzhou 510008, China
  • show less
    DOI: 10.3788/COL202220.091201 Cite this Article Set citation alerts
    Yunlong Zhu, Zhuoran Li, Xu Lu, Yonggui Yuan, Jun Yang. White light interferometry with spectral-temporal demodulation for large-range thickness measurement[J]. Chinese Optics Letters, 2022, 20(9): 091201 Copy Citation Text show less
    Experimental results for a single measurement of 500 nm SiO2 coating. (a) Reflectance spectrum F(k), Fref(k), and Fp(k). (b) Comparison of measured reflectance R(k) and theoretical model. (c) Normalized sum of squared errors for reflectance fitting between the experimental result and theoretical model at different values of input thickness. (d) Detailed view of (c) showing the minimum sum of squared errors.
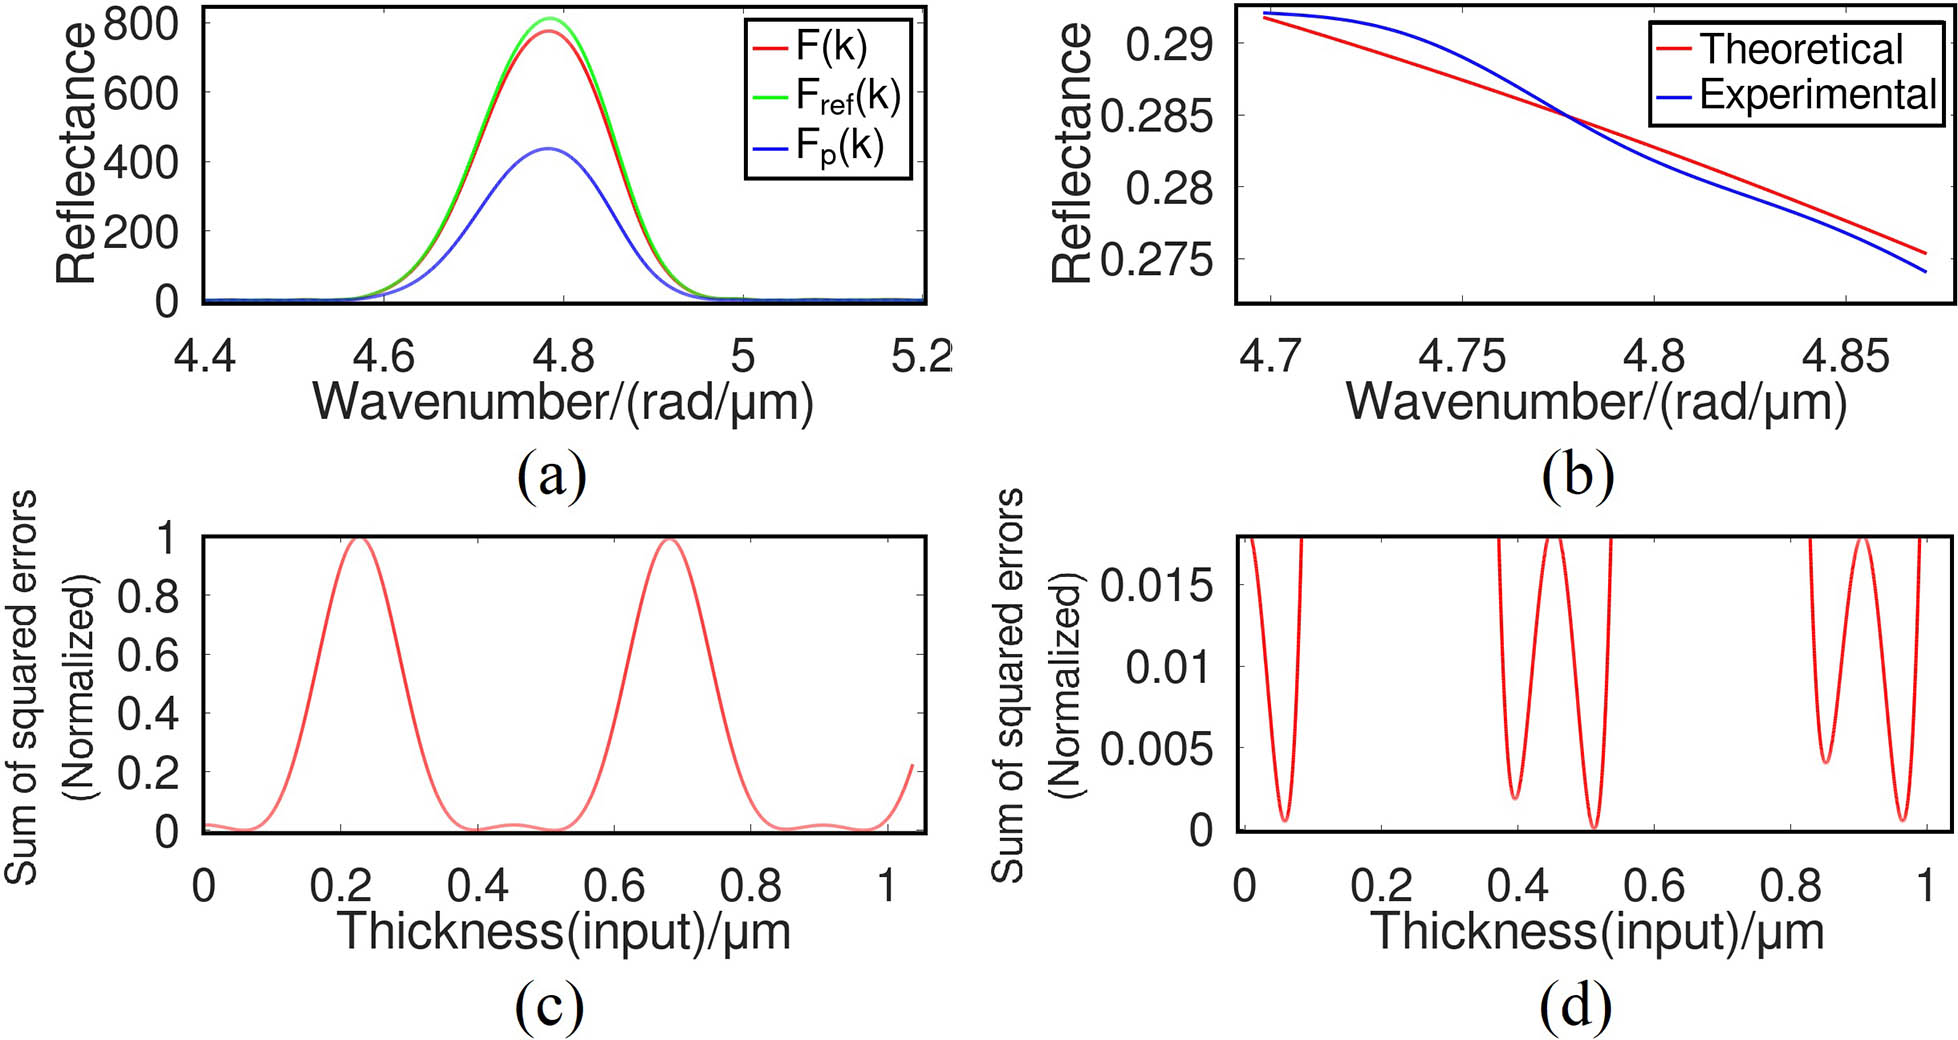
    Fig. 1. Experimental results for a single measurement of 500 nm SiO2 coating. (a) Reflectance spectrum F(k), Fref(k), and Fp(k). (b) Comparison of measured reflectance R(k) and theoretical model. (c) Normalized sum of squared errors for reflectance fitting between the experimental result and theoretical model at different values of input thickness. (d) Detailed view of (c) showing the minimum sum of squared errors.
    Experimental results for a single measurement of 68 µm Si film. (a) Reflectance spectrum F(k), Fref(k), and Fp(k). (b) Comparison of measured reflectance R(k) and theoretical model. (c) Normalized sum of squared errors for reflectance fitting between the experimental result and theoretical model at different values of input thickness. (d) Detailed view of (c) showing the minimum sum of squared errors.
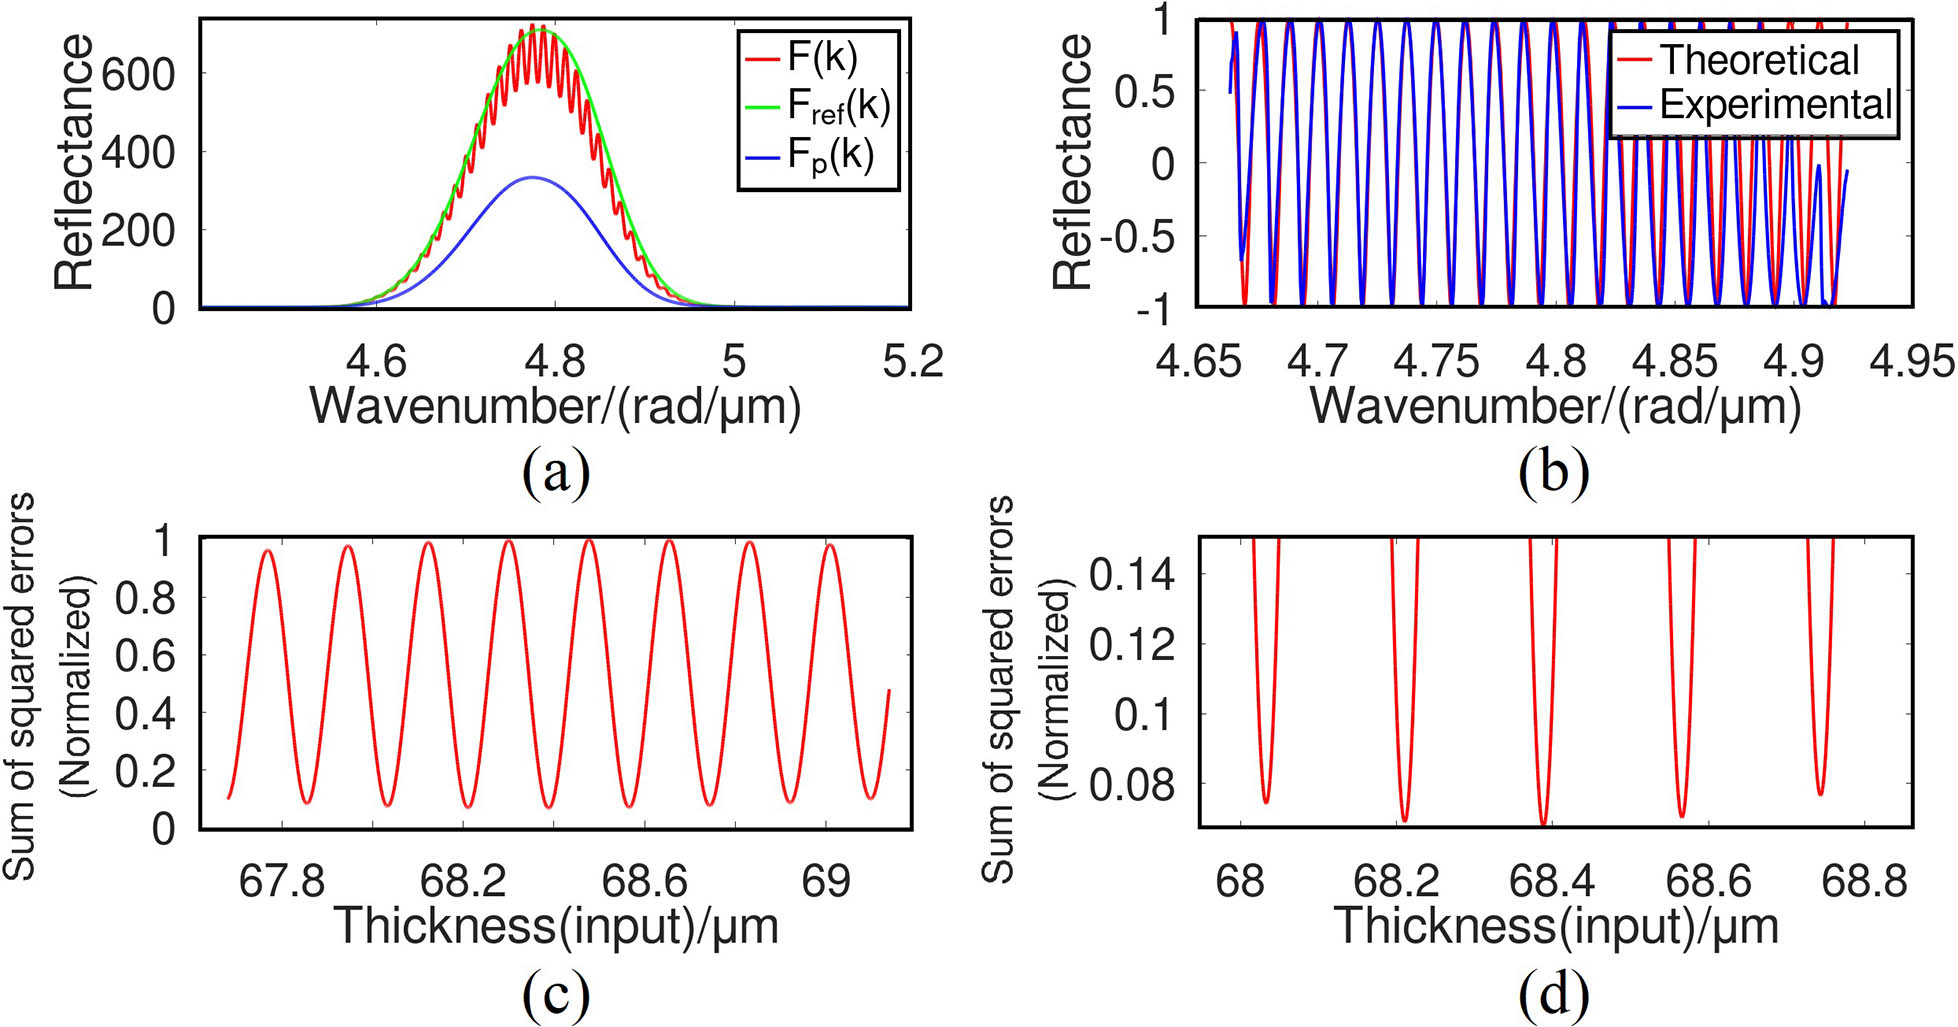
    Fig. 2. Experimental results for a single measurement of 68 µm Si film. (a) Reflectance spectrum F(k), Fref(k), and Fp(k). (b) Comparison of measured reflectance R(k) and theoretical model. (c) Normalized sum of squared errors for reflectance fitting between the experimental result and theoretical model at different values of input thickness. (d) Detailed view of (c) showing the minimum sum of squared errors.
    Number of MeasurementPoint APoint BPoint CPoint DPoint E
    1st508.18511.34506.86508.84513.53
    2nd508.67511.09505.66508.62512.71
    3rd507.31511.60506.88508.98512.03
    4th507.65511.36506.52508.26512.81
    5th508.00511.53506.03507.23512.07
    Average507.96511.38506.39508.39512.63
    Standard deviation0.520.200.530.700.62
    Table 1. Measurement Results for 500 nm SiO2 Coating (nm)
    Number of MeasurementPoint APoint BPoint CPoint DPoint E
    1st68,613.5968,348.3768,394.2168,299.2568,554.65
    2nd68,646.3368,345.0968,364.7468,243.5968,528.46
    3rd68,613.5968,322.1768,387.6668,282.8868,557.92
    4th68,643.0668,341.8268,404.0368,276.3368,535.00
    5th68,597.2268,358.1968,390.9368,295.9868,593.94
    Average68,622.7668,343.1368,388.3168,279.6168,554.00
    Standard deviation2113152226
    Table 2. Measurement Results for 68 µm Si Film Using Envelope Method (nm)
    Number of MeasurementPoint APoint BPoint CPoint DPoint E
    1st68,628.9768,358.9168,387.2368,330.2068,563.33
    2nd68,628.6468,358.9768,387.5868,331.6868,563.89
    3rd68,629.0168,359.568,388.3368,332.7668,564.37
    4th68,628.8068,359.3868,388.3568,332.8668,564.22
    5th68,629.0368,359.5868,388.6868,333.1768,564.56
    Average68,628.8968,359.2768,388.0468,332.1368,564.07
    Standard deviation0.170.310.601.20.48
    Table 3. Measurement Results for 68 µm Si Film Using the Proposed Method (nm)
    Uncertainty ComponentSourceUncertainty Contribution
    u(lH)Measurement results0.31 nm (see Table 1)
    11.63 nm (see Table 2)
    0.54 nm (see Table 3)
    u(lf)Nominal wavelength4.35×102nm
    u(lT)Temperature change6.93×107H (for SiO2)
    2.89×10⁶H (for Si)
    u(ls)Film installation2×109H
    Table 4. Summary of Measurement Uncertainty Components
    Yunlong Zhu, Zhuoran Li, Xu Lu, Yonggui Yuan, Jun Yang. White light interferometry with spectral-temporal demodulation for large-range thickness measurement[J]. Chinese Optics Letters, 2022, 20(9): 091201
    Download Citation