
Lu Chu, Bin Liu, Liang Xu, Zhiwei Li, Baofeng Zhang. Speckle Quality Evaluation Based on Gray Level Co-Occurrence Matrix[J]. Laser & Optoelectronics Progress, 2021, 58(4): 0410019
- Laser & Optoelectronics Progress
- Vol. 58, Issue 4, 0410019 (2021)
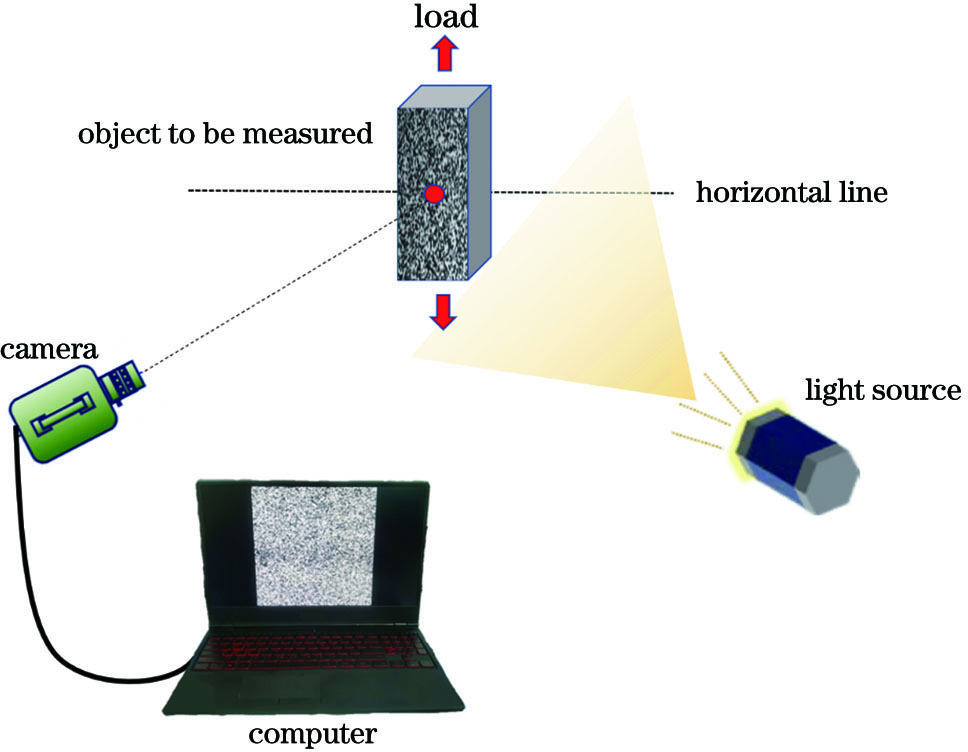
Fig. 1. Speckle measuring system based on DIC method
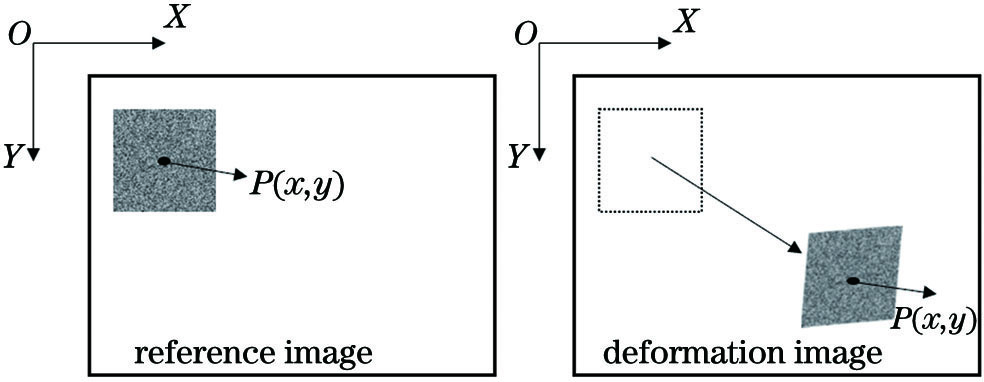
Fig. 2. Schematic of measuring principle of DIC method
Fig. 3. Process of converting original image to GLCM
Fig. 4. Results of 4 speckle patterns after translation. (a) Error; (b) standard deviation
Fig. 5. Mean gray second derivative of 4 speckle patterns
Fig. 6. Results of speckle pattern processing. (a) Speckle patterns; (b) gray histogram
Fig. 7. Full-field displacement changes in u direction of 4 speckle patterns under different displacement quantities. (a) 0.05 pixel; (b) 0.95 pixel; (c) 1.00 pixel
Fig. 8. Effect of 4 speckle patterns with uneven illumination. (a) Image A; (b) image B; (c) image C; (d) image D
Fig. 9. Error and standard deviation of 4 speckle images with non-uniform illumination. (a) Error; (b) standard deviation
Fig. 10. Results of speckle image C under different average gray values. (a) 208.1751; (b) 140.8798; (c) 97.3179;(d) 62.6947; (e) 50.8449; (f) 23.8115; (g) 2.5869
Fig. 11. Results of 4 speckle patterns at different brightness states. (a) Error; (b) standard deviation
| |||||||||||||||||||||||||||||||||||||||||||||||||||||
Table 1. GLCM eigenvalues of 4 speckle patterns
| |||||||||||||||||||||||||||||||||||||||||||||||||||||
Table 2. GLCM eigenvalues of 4 speckle patterns with non-uniform illumination
|
Table 3. Shannon entropy of 4 speckle patterns with non-uniform llumination
|
Table 4. GLCM eigenvalues of speckle pattern under different luminance states


Set citation alerts for the article
Please enter your email address

© Copyright 2018-2021 | Chinese Laser Press. All Rights Reserved 沪ICP备15018463号-20