
Huige Di, Jianyu Wang, Xuan Zhao, Geng Han, Xiaonan Wen, Xingqi Zhang, Yufeng Wang, Yuehui Song, Dengxin Hua. Method for Detecting Atmospheric Pressure Profile Using Rotational and Vibrational Raman Lidar[J]. Acta Optica Sinica, 2020, 40(15): 1501001
- Acta Optica Sinica
- Vol. 40, Issue 15, 1501001 (2020)
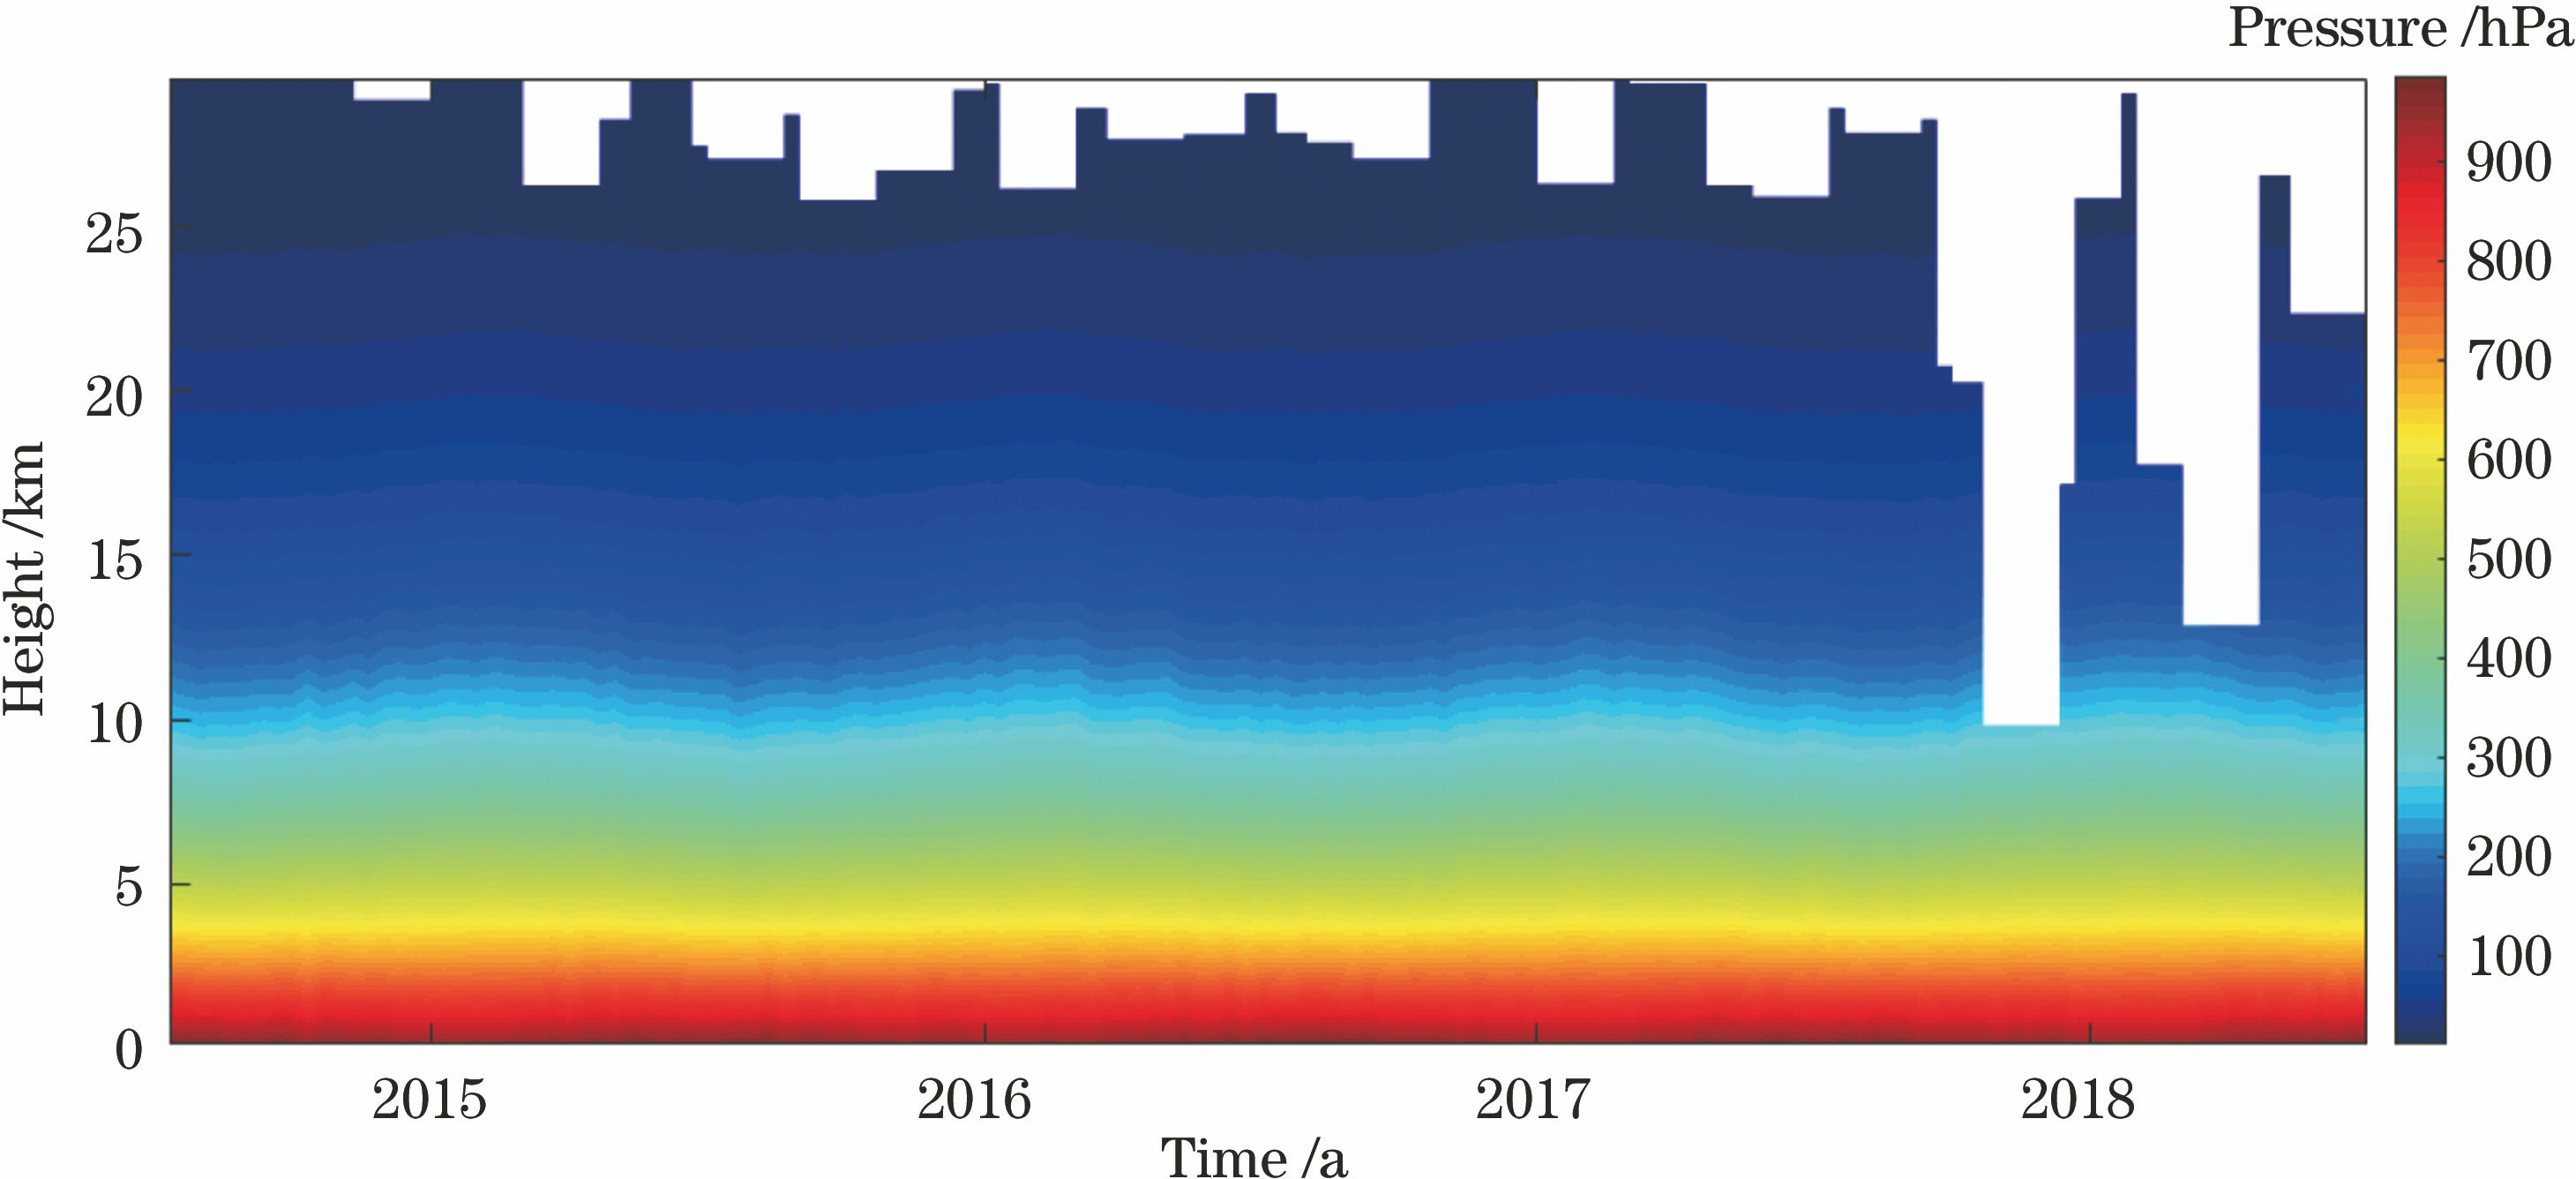
Fig. 1. Atmospheric pressure over Xian from 2015 to 2018
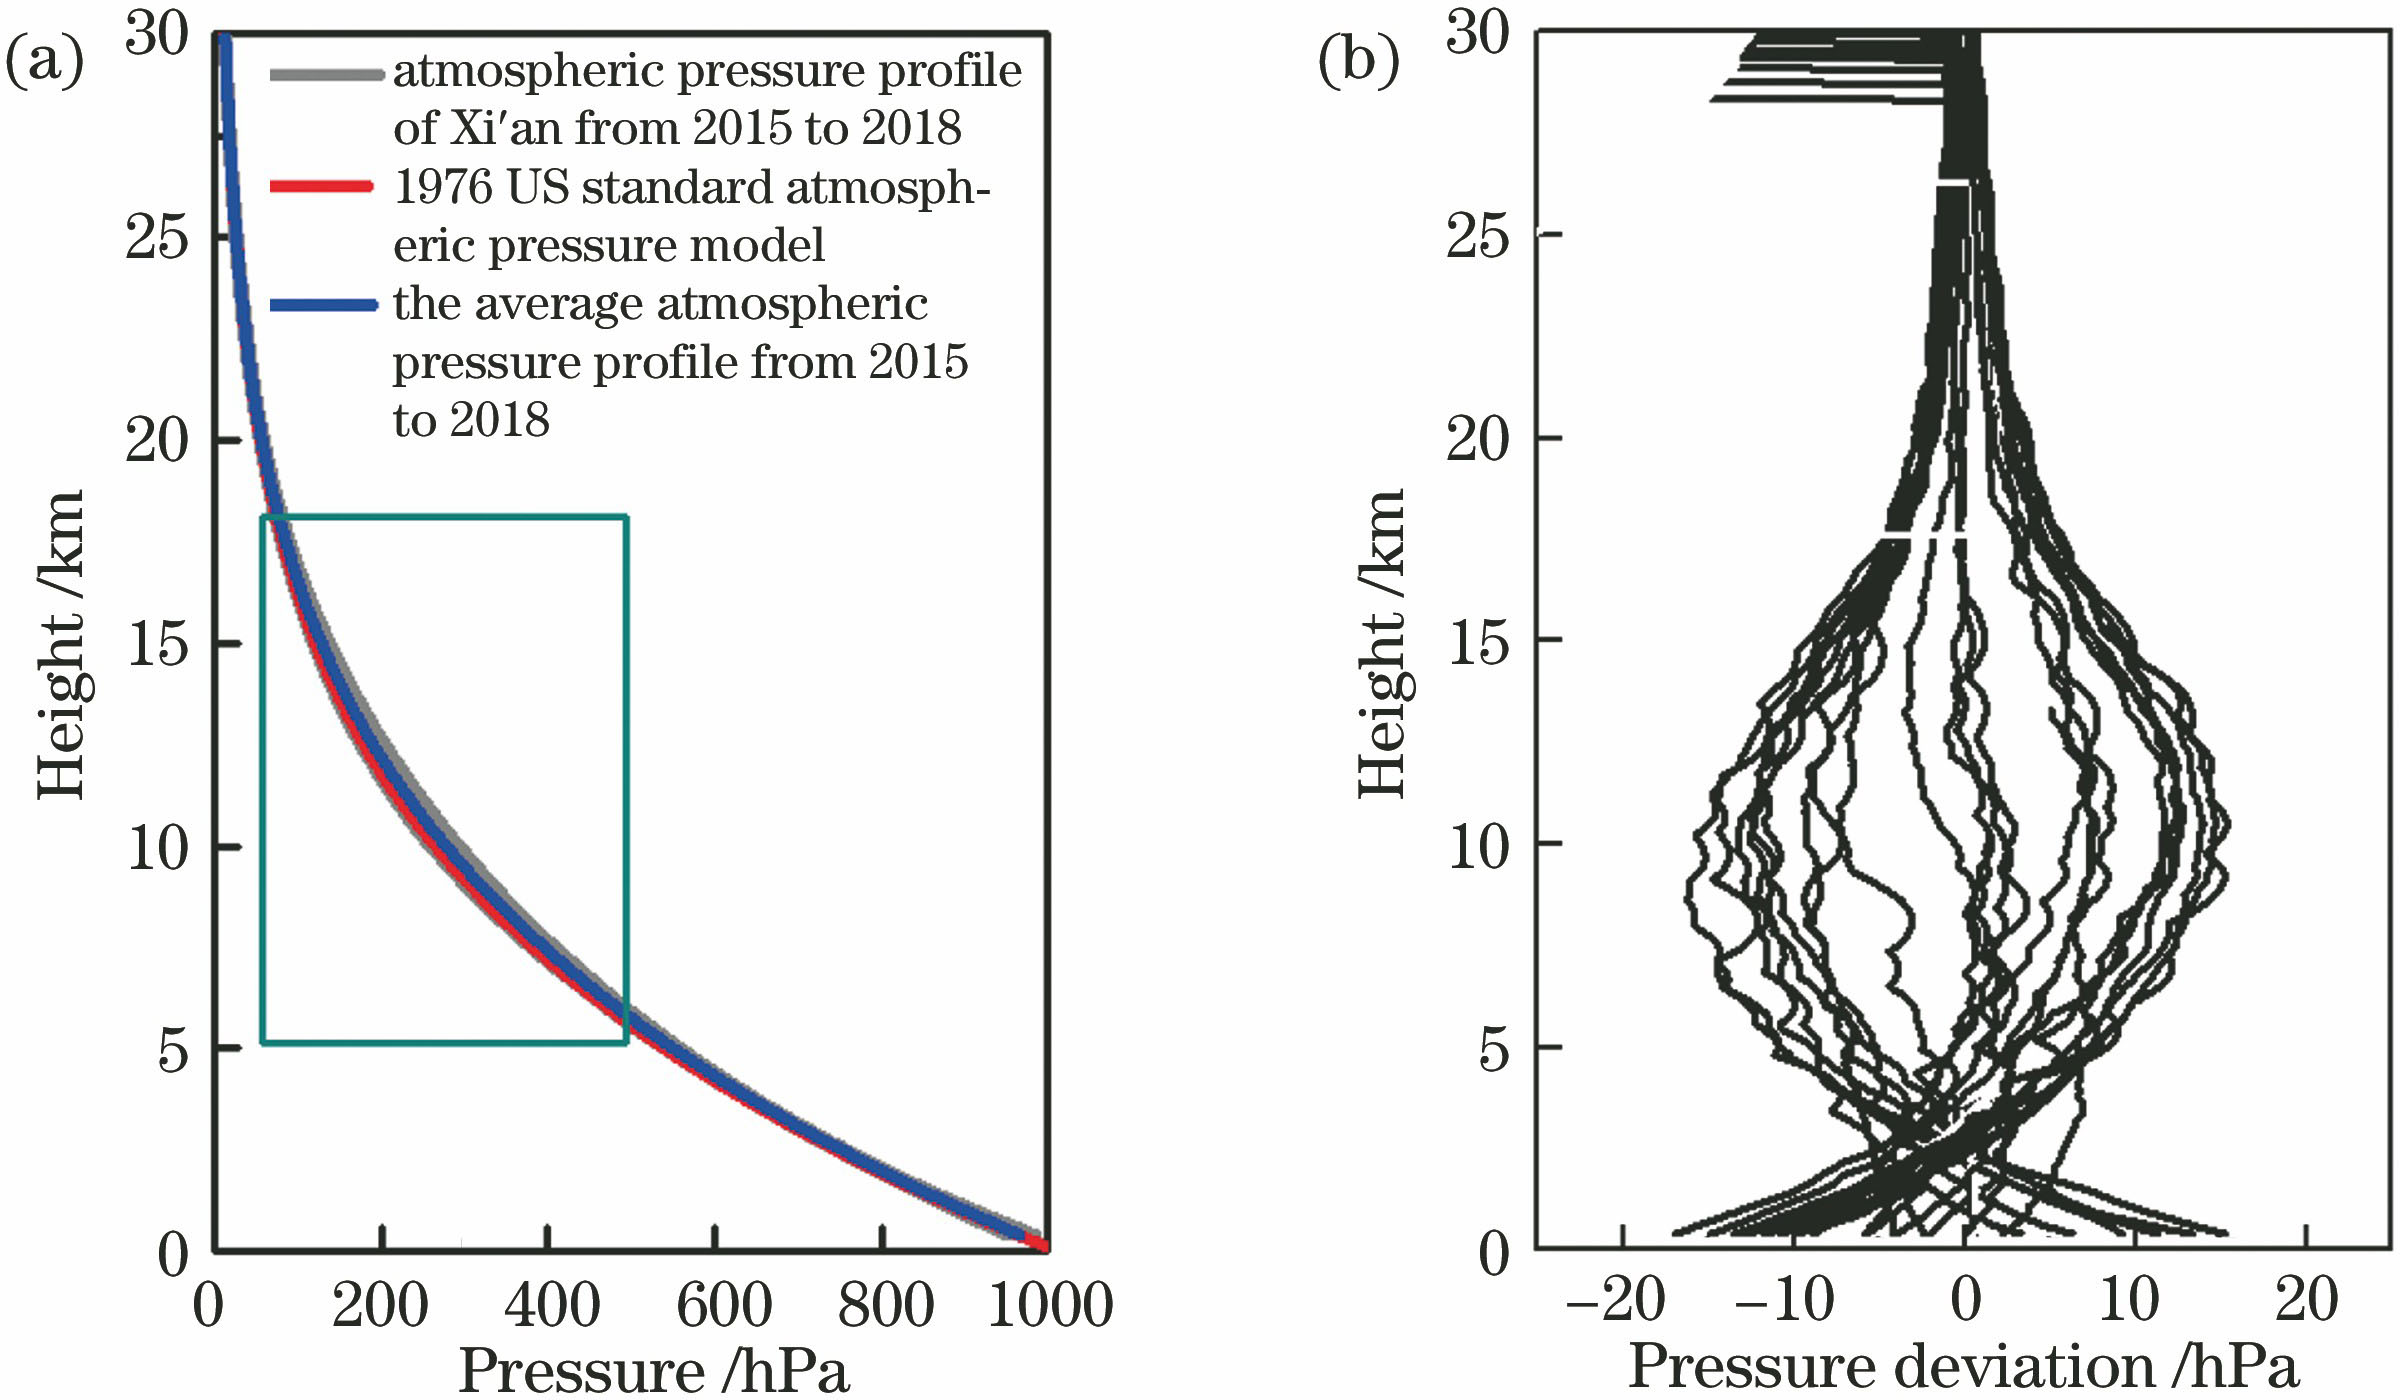
Fig. 2. Atmospheric pressure profiles over Xian. (a) 4-year atmospheric pressure profiles from sounding balloon and the 1976 US standard atmospheric pressure model; (b) fluctuation of atmospheric pressure with height
Fig. 3. Layout of Raman lidar system
Fig. 4. Spectroscopic system diagram of Raman lidar
Fig. 5. Atmospheric temperature and pressure profiles. (a) Temperature profile; (b) pressure profile
Fig. 6. Atmospheric pressure error profile between sounding pressure and the retrieval of sounding temperature
Fig. 7. Pressure inversion error due to temperature error. (a) Temperature profile with 5 K random error; (b) temperature profile with 5 K random error and 3 K fixed error; (c) atmospheric pressure error profile
Fig. 8. Errors of atmospheric pressure profile obtained from measured temperature data by lidar. (a) Temperature profile 1 with error 1 and sounding temperature profile; (b) temperature profile 2 with error 2 and sounding temperature profile; (c) atmospheric pressure error profile caused by temperature error in two cases; (d) profile of pressure errors in two cases including temperature inversion error and sounding data error
Fig. 9. Atmospheric pressure inversion error introduced by reference point pressure deviation
Fig. 10. Specific humidity and pressure inversion error. (a) Specific humidity profile from sounding balloon; (b) pressure inversion error introduced by specific humidity
Fig. 11. Comparison of atmospheric temperature, water vapor mixing ratio from lidar and sounding balloon. (a) Range-squared-corrected signal (RSCS); (b) temperature profiles; (c) water vapor mixing ratio profiles
Fig. 12. Atmospheric pressure profile retrieved from lidar data and error profile. (a) Atmospheric pressure profile; (b) inversion error profile
Fig. 13. Temperature error profile and the corresponding pressure error profile
| |||||||||||||||||||||||||||||||||||||||||||||||||||||||||||||||||||||||||||||||||||||||||||||||||||||
Table 1. Parameters of Raman lidar system


Set citation alerts for the article
Please enter your email address

© Copyright 2018-2021 | Chinese Laser Press. All Rights Reserved 沪ICP备15018463号-20