• Photonics Research
  • Vol. 10, Issue 5, 1290 (2022)
Yaozu Xie1, Jiaqi Li1, Yanfeng Zhang1、2、*, Zeru Wu1, Shihao Zeng1, Shuqing Lin1, Zhaoyang Wu1, Wenchao Zhou1, Yujie Chen1, and Siyuan Yu1、3、*
Author Affiliations
  • 1State Key Laboratory of Optoelectronic Materials and Technologies, School of Electronics and Information Technology, Sun Yat-sen University, Guangzhou 510275, China
  • 2e-mail: zhangyf33@mail.sysu.edu.cn
  • 3e-mail: yusy@mail.sysu.edu.cn
  • show less
    DOI: 10.1364/PRJ.454816 Cite this Article Set citation alerts
    Yaozu Xie, Jiaqi Li, Yanfeng Zhang, Zeru Wu, Shihao Zeng, Shuqing Lin, Zhaoyang Wu, Wenchao Zhou, Yujie Chen, Siyuan Yu. Soliton frequency comb generation in CMOS-compatible silicon nitride microresonators[J]. Photonics Research, 2022, 10(5): 1290 Copy Citation Text show less
    Overview of the propagation loss in low-temperature SiNx waveguides (upper panel) where the gray dashed line indicates the value of 0.1 dB/cm, while states of Kerr combs based on both LPCVD and other SiNx platforms are shown in the lower panel where the gray dashed line separates the effective blue/red-detuning regions corresponding to the noisy/coherent Kerr combs. MI, modulation instability; SC, soliton crystal; PSC, perfect soliton crystal. All used images are taken from Refs. [18–23" target="_self" style="display: inline;">–23].
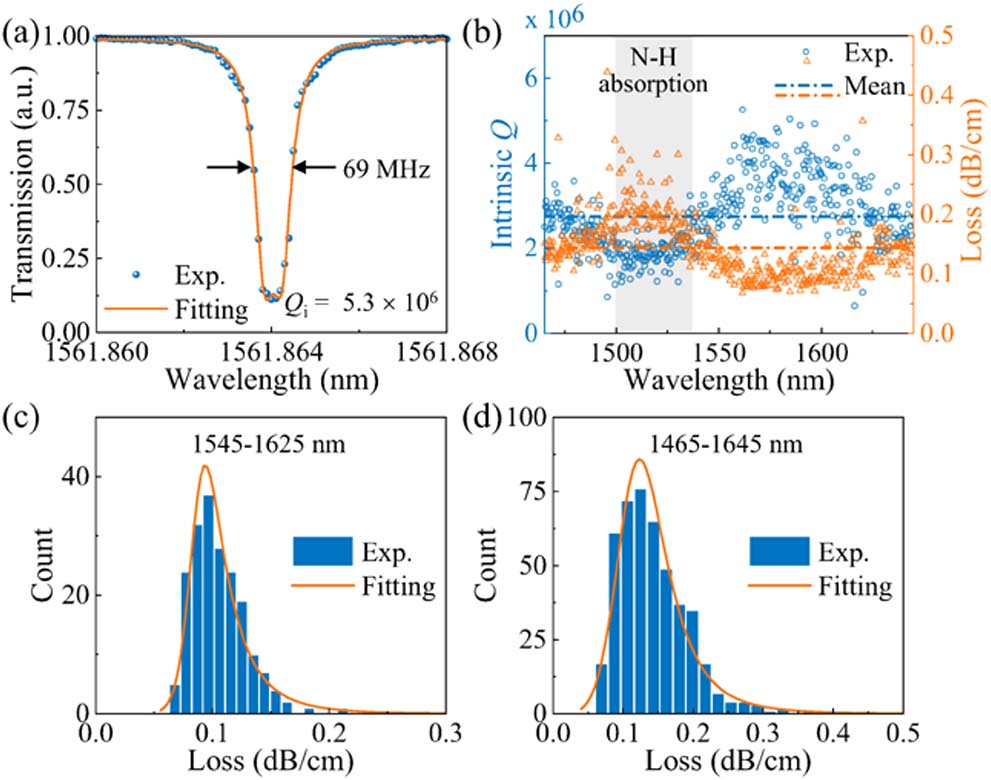
    Fig. 1. Overview of the propagation loss in low-temperature SiNx waveguides (upper panel) where the gray dashed line indicates the value of 0.1 dB/cm, while states of Kerr combs based on both LPCVD and other SiNx platforms are shown in the lower panel where the gray dashed line separates the effective blue/red-detuning regions corresponding to the noisy/coherent Kerr combs. MI, modulation instability; SC, soliton crystal; PSC, perfect soliton crystal. All used images are taken from Refs. [1823" target="_self" style="display: inline;">23].
    (a) Measured and fitted TE0 resonance at 1561.864 nm from the 480 μm radius SiNx:D MRR. (b) Measured Qi and propagation loss of the MRR. Mean values (dashed line) are shown for reference. The gray area indicates the wavelength range of N–H bond absorption due to the SiOx:H cladding. (c) Histogram and burr fitting of propagation loss in the 1545–1625 nm wavelength range over 194 TE0 resonances. (d) Histogram and burr fitting of propagation loss in the 1465–1645 nm wavelength range over 454 TE0 resonances.
    Fig. 2. (a) Measured and fitted TE0 resonance at 1561.864 nm from the 480 μm radius SiNx:D MRR. (b) Measured Qi and propagation loss of the MRR. Mean values (dashed line) are shown for reference. The gray area indicates the wavelength range of N–H bond absorption due to the SiOx:H cladding. (c) Histogram and burr fitting of propagation loss in the 1545–1625 nm wavelength range over 194 TE0 resonances. (d) Histogram and burr fitting of propagation loss in the 1465–1645 nm wavelength range over 454 TE0 resonances.
    (a) Micrograph of a SiNx:D MRR with a radius of 160 μm. (b) Measured transmission spectrum and corresponding QL in the wavelength range of 1500–1600 nm. (c) Measured and fitted TE0 resonance at around 1560.39 nm. (d) Measured comb power evolutions for different wavelengths of the auxiliary laser λAux with the power of ∼190 mW, as a continuous wave (CW) pump laser with the power of ∼130 mW adiabatically scans from the blue- to red-detuning regimes of the pump mode at the speed of 1 nm/s. The enlarged image for the wavelength of 1546.36 nm is shown as the inset. (e) Optical spectra of the generated frequency combs referring to different pump detuning positions in (d), where fitted curves of soliton states are also presented. (f) Optical spectrum as well as its sech2 fitted envelop of the single soliton state. A local oscillator laser at 1549.982 nm (the yellow solid line) for heterodyne beat note measurement is shown as a reference. The enlarged inset indicates the FSR of ∼150 GHz. (g) Intensity noise spectra of the background, the MI state, and the single soliton state. (h) Beat note between the selected comb line and the local oscillating laser for the state of the single soliton. RBW, resolution bandwidth.
    Fig. 3. (a) Micrograph of a SiNx:D MRR with a radius of 160 μm. (b) Measured transmission spectrum and corresponding QL in the wavelength range of 1500–1600 nm. (c) Measured and fitted TE0 resonance at around 1560.39 nm. (d) Measured comb power evolutions for different wavelengths of the auxiliary laser λAux with the power of 190  mW, as a continuous wave (CW) pump laser with the power of 130  mW adiabatically scans from the blue- to red-detuning regimes of the pump mode at the speed of 1 nm/s. The enlarged image for the wavelength of 1546.36 nm is shown as the inset. (e) Optical spectra of the generated frequency combs referring to different pump detuning positions in (d), where fitted curves of soliton states are also presented. (f) Optical spectrum as well as its sech2 fitted envelop of the single soliton state. A local oscillator laser at 1549.982 nm (the yellow solid line) for heterodyne beat note measurement is shown as a reference. The enlarged inset indicates the FSR of 150  GHz. (g) Intensity noise spectra of the background, the MI state, and the single soliton state. (h) Beat note between the selected comb line and the local oscillating laser for the state of the single soliton. RBW, resolution bandwidth.
    Optical spectra of single soliton combs with repetition rates of 50–240 GHz generated from MRRs with different radii. The enlarged insets show the spectral details from 1519 to 1522 nm wavelength range.
    Fig. 4. Optical spectra of single soliton combs with repetition rates of 50–240 GHz generated from MRRs with different radii. The enlarged insets show the spectral details from 1519 to 1522 nm wavelength range.
    Yaozu Xie, Jiaqi Li, Yanfeng Zhang, Zeru Wu, Shihao Zeng, Shuqing Lin, Zhaoyang Wu, Wenchao Zhou, Yujie Chen, Siyuan Yu. Soliton frequency comb generation in CMOS-compatible silicon nitride microresonators[J]. Photonics Research, 2022, 10(5): 1290
    Download Citation