
Xia Wang, Wei Zhang. Multi-View Indoor Human Detection Neural Network Based on Joint Learning[J]. Acta Optica Sinica, 2019, 39(2): 0210002
- Acta Optica Sinica
- Vol. 39, Issue 2, 0210002 (2019)
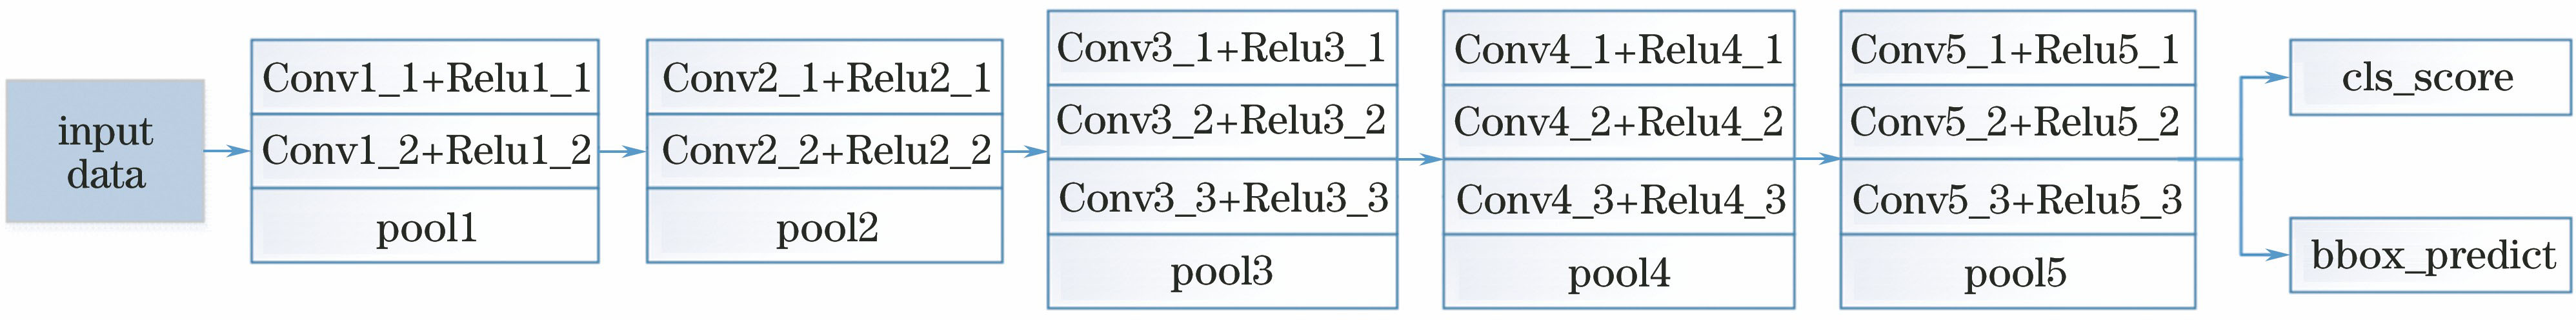
Fig. 1. Architecture of region proposal network
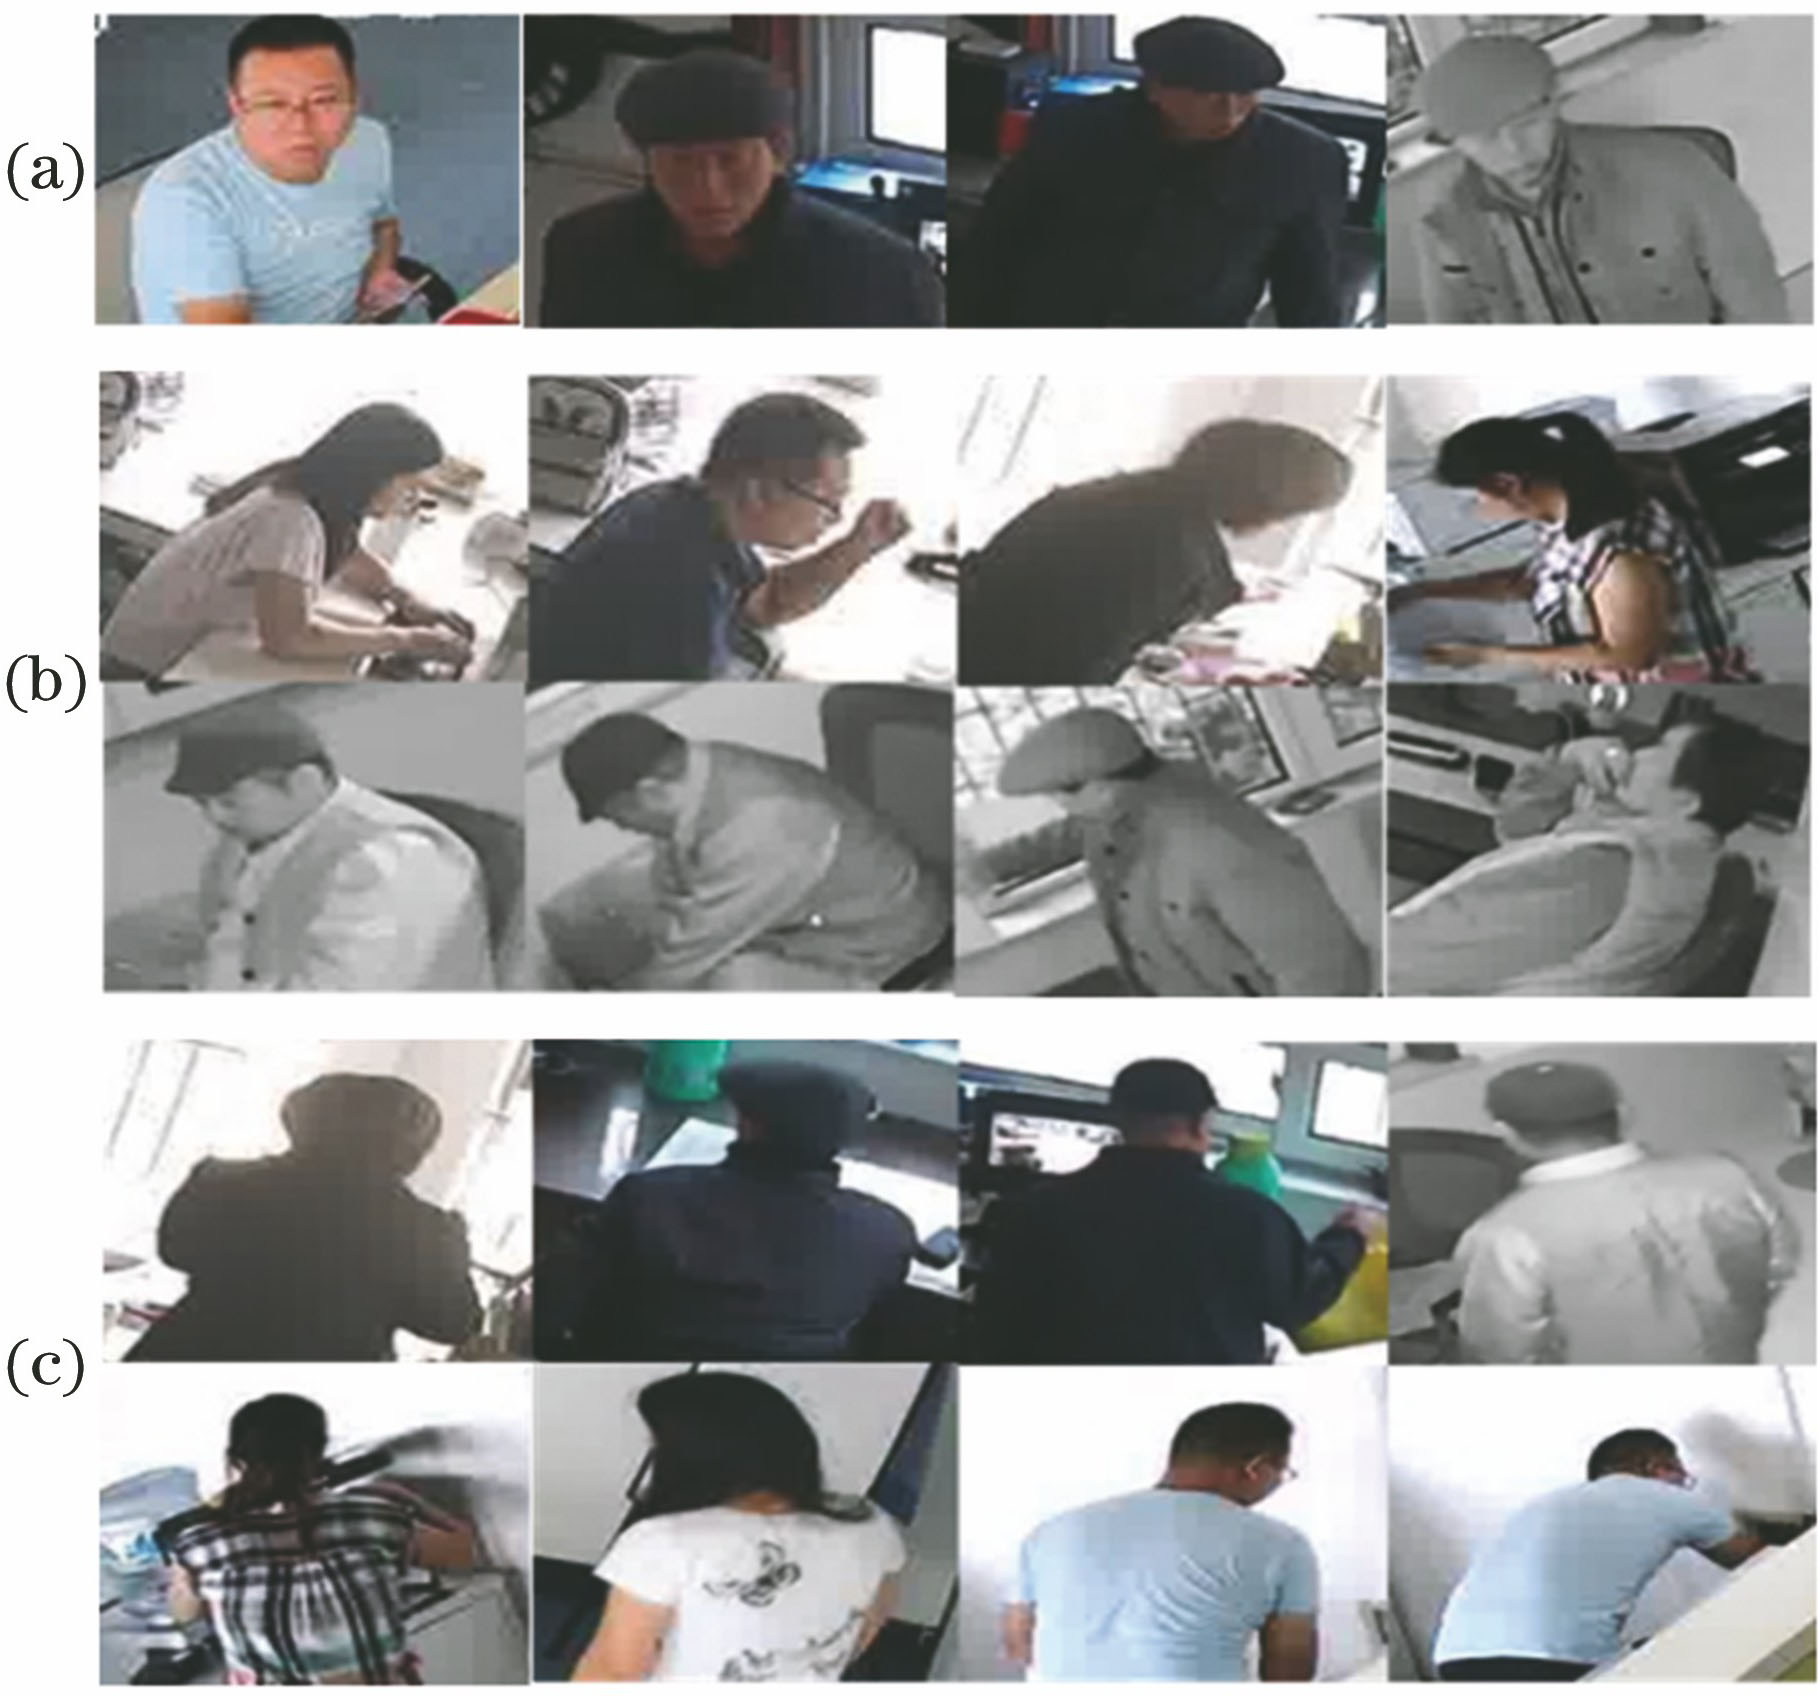
Fig. 2. Multi-view samples. (a) Frontal view; (b) profile view; (c) back view
Fig. 3. Architecture of MVNN
Fig. 4. Principal detection neural network model of MVNN
Fig. 5. Three channels of input layer. (a) Sample 1; (b) sample 2
Fig. 6. Calculation model of part score for deformation layer
Fig. 7. Comparison results of region proposal for input data. (a) HOG+Adaboost algorithm; (b) Proposed region proposal algorithm
Fig. 8. Testing result of multi-view model. (a) Testing result of multiple views; (b) Comparison results of single-view model and multi-view model
Fig. 9. Testing result of DPM
Fig. 10. Testing result of proposed algorithm on IHDD. (a) RFPPI-RMR curve; (b) P-R curve
|
Table 1. Parameters of part filters in proposed algorithm
|
Table 2. Indoor human detection dataset
|
Table 3. Parameter setting of second-stage network model
|
Table 4. Quantitative comparison of different algorithms on dataset

Set citation alerts for the article
Please enter your email address
© Copyright 2018-2021 | Chinese Laser Press. All Rights Reserved 沪ICP备15018463号-20