
Xiahui Zeng. Configuration optimization of off-axis parabolic mirror for enhancing the focusability of a laser beam[J]. Chinese Optics Letters, 2021, 19(3): 032601
- Chinese Optics Letters
- Vol. 19, Issue 3, 032601 (2021)
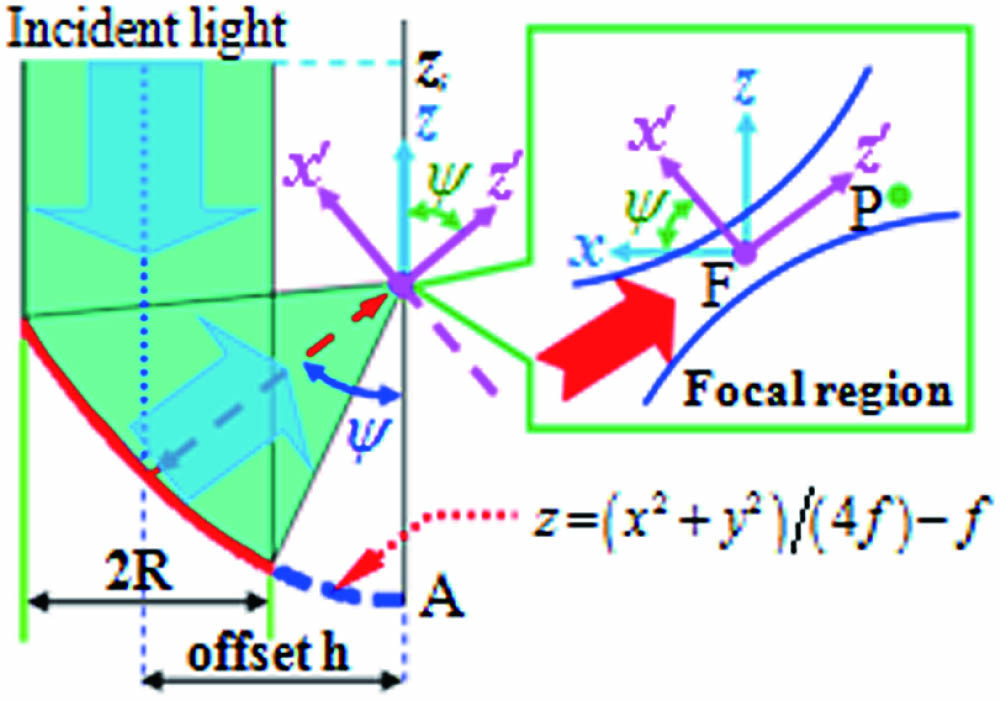
Fig. 1. Schematic illustration of reflection of the OAP and sketch of the Cartesian coordinate systems S (x, y, z) and S′(x′,y′,z′). Focus F of the OAP coincides with origins of the Cartesian coordinate systems. Inset shows beam propagation in the vicinity of focus F.
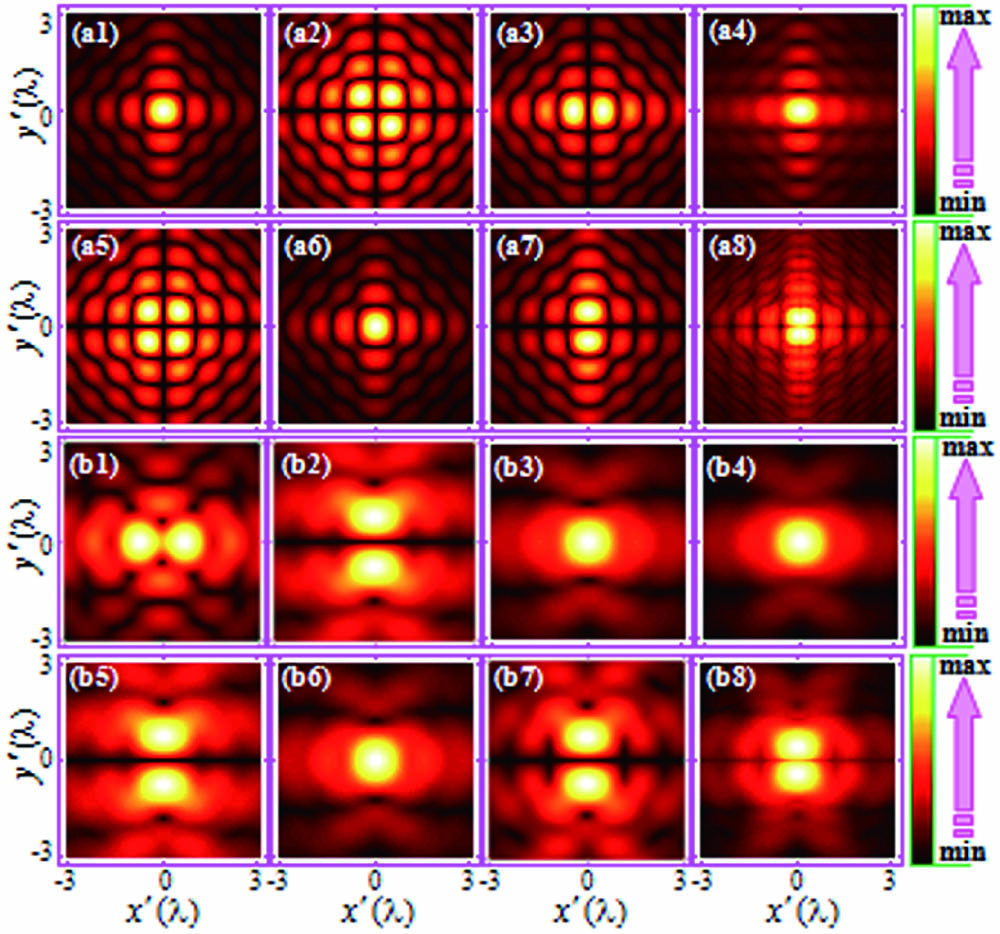
Fig. 2. Electromagnetic field intensity distributions focused by f/0.5 OAPs with h = 0 for (a1)
Fig. 3. Focused electric field intensity transverse distributions of (a)
Fig. 4. Peak intensity of electric total field focused by OAPs with different f as a function of offset h for various aperture sizes R of (a) 80 mm, (b) 120 mm, and (c) 160 mm. The dotted line represents the position of h = 1.25R.
Fig. 5. Offset of OAP in the optimum configuration, resulting in achievement of the maximum peak intensity, as a function of the parabola f-number.
Fig. 6. Tolerances of (a) OAP offset and (b) off-axis angle to a 5% decrease of the maximum focused peak intensity as functions of the parabola f-number.

Set citation alerts for the article
Please enter your email address
© Copyright 2018-2021 | Chinese Laser Press. All Rights Reserved 沪ICP备15018463号-20