• Chinese Journal of Chemical Physics
  • Vol. 33, Issue 5, 635 (2020)
Jing Long1, Zhao Ye1, Yong Du2, Xu-ming Zheng1, and Jia-dan Xue1、*
Author Affiliations
  • 1Department of Chemistry, Zhejiang Sci-Tech University, Hangzhou 310018, China
  • 2Centre for THz Research, China Jiliang University, Hangzhou 310018, China
  • show less
    DOI: 10.1063/1674-0068/cjcp2006107 Cite this Article
    Jing Long, Zhao Ye, Yong Du, Xu-ming Zheng, Jia-dan Xue. Direct Observation of Transient Species Generated from Protonation and Deprotonation of the Lowest Triplet of p-Nitrophenylphenol[J]. Chinese Journal of Chemical Physics, 2020, 33(5): 635 Copy Citation Text show less
    The transient absorption spectra obtained immediately after the laser excitation of HO-Bp-NO2 in acetonitrile (MeCN) solution without acid (orange) and with 0.38 mol/mL HClO\begin{document}$ _4 $\end{document} (green). Blue bars represent vertical transitions of \begin{document}$ ^3 $\end{document}HO-Bp-NO2H\begin{document}$ ^+ $\end{document} predicted by TDDFT calculation. A scaled UV-Vis spectrum of HO-Bp-NO2 in MeCN (dashed line) is also provided for comparison.
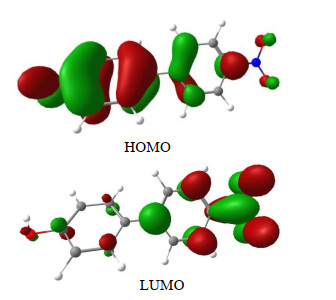
    Fig. 1. The transient absorption spectra obtained immediately after the laser excitation of HO-Bp-NO2 in acetonitrile (MeCN) solution without acid (orange) and with 0.38 mol/mL HClO\begin{document}$ _4 $\end{document} (green). Blue bars represent vertical transitions of \begin{document}$ ^3 $\end{document}HO-Bp-NO2H\begin{document}$ ^+ $\end{document} predicted by TDDFT calculation. A scaled UV-Vis spectrum of HO-Bp-NO2 in MeCN (dashed line) is also provided for comparison.
    The molecular structure diagrams corresponding to the abbreviations mentioned in text.
    Fig. 1. The molecular structure diagrams corresponding to the abbreviations mentioned in text.
    Plot of HOMO and LUMO of HO-Bp-NO2 corresponding to S0\begin{document}$ \to $\end{document} S1 transition obtained with TDDFT calculation at the PBE//B3LYP/6-311++G(d, p) with PCM solvent model in acetonitrile.
    Fig. 1. Plot of HOMO and LUMO of HO-Bp-NO2 corresponding to S0\begin{document}$ \to $\end{document} S1 transition obtained with TDDFT calculation at the PBE//B3LYP/6-311++G(d, p) with PCM solvent model in acetonitrile.
    Transient absorption spectrum obtained immediately after 355 nm laser pulse photolysis of HO-Bp-NO2 in cyclohexane (CHX) compared to that in acetonitrile (MeCN).
    Fig. 2. Transient absorption spectrum obtained immediately after 355 nm laser pulse photolysis of HO-Bp-NO2 in cyclohexane (CHX) compared to that in acetonitrile (MeCN).
    [in Chinese]
    Fig. 2. [in Chinese]
    Nanosecond transient absorption spectra upon laser excitation of HO-Bp-NO2 in acetonitrile in the presence of 0.1 mmol/L acid. Insert: (black) kinetics monitored at 660 and 450 nm, and (red) exponential curves fitted with a single decay (660 nm) and a combined (growth and decay) functions respectively.
    Fig. 2. Nanosecond transient absorption spectra upon laser excitation of HO-Bp-NO2 in acetonitrile in the presence of 0.1 mmol/L acid. Insert: (black) kinetics monitored at 660 and 450 nm, and (red) exponential curves fitted with a single decay (660 nm) and a combined (growth and decay) functions respectively.
    Nanosecond transient absorption spectra obtained immediately after laser excitation of Bp-NO2 in acetonitrile solution containing various concentrations of HClO\begin{document}$ _4 $\end{document}.
    Fig. 3. Nanosecond transient absorption spectra obtained immediately after laser excitation of Bp-NO2 in acetonitrile solution containing various concentrations of HClO\begin{document}$ _4 $\end{document}.
    [in Chinese]
    Fig. 3. [in Chinese]
    Molecular structure of (top) close-shell and (middle) open-shell singlet of O-Bp-NO2H. (bottom) The spin density contribution for O-Bp-NO2H, plotted with Multiwfn software1.
    Fig. 3. Molecular structure of (top) close-shell and (middle) open-shell singlet of O-Bp-NO2H. (bottom) The spin density contribution for O-Bp-NO2H, plotted with Multiwfn software1.
    Nanosecond transient absorption spectra obtained immediately after laser excitation of HO-Bp-NO2 in acetonitrile solution containing various concentrations of acid. Symbol star indicates the residual of excitation laser pulse.
    Fig. 4. Nanosecond transient absorption spectra obtained immediately after laser excitation of HO-Bp-NO2 in acetonitrile solution containing various concentrations of acid. Symbol star indicates the residual of excitation laser pulse.
    Nanosecond transient absorption spectra upon laser excitation of HO-Bp-NO2 in acetonitrile in the presence of various concentration of acid.
    Fig. 4. Nanosecond transient absorption spectra upon laser excitation of HO-Bp-NO2 in acetonitrile in the presence of various concentration of acid.
    (a) Nanosecond transient absorption spectra recorded at various time delays after laser pulse excitation of HO-Bp-NO2 (0.05 mmol/L) in neat acetonitrile. (b) Difference spectra obtained by subtraction of scaled 0 ns spectra from those recorded at post time delays which have been labeled in the graph, with the criterion of completely removing the absorption of \begin{document}$ ^3 $\end{document}HO-Bp-NO2 at 650 nm, and 1.0 \begin{document}$ {\rm{ \mathsf{ μ} }} $\end{document}s spectrum (orange) in solution in the presence of 0.1 mmol/L NpOH.
    Fig. 5. (a) Nanosecond transient absorption spectra recorded at various time delays after laser pulse excitation of HO-Bp-NO2 (0.05 mmol/L) in neat acetonitrile. (b) Difference spectra obtained by subtraction of scaled 0 ns spectra from those recorded at post time delays which have been labeled in the graph, with the criterion of completely removing the absorption of \begin{document}$ ^3 $\end{document}HO-Bp-NO2 at 650 nm, and 1.0 \begin{document}$ {\rm{ \mathsf{ μ} }} $\end{document}s spectrum (orange) in solution in the presence of 0.1 mmol/L NpOH.
    Kinetics (black) monitored at 450 nm obtained upon excitation of HO-Bp-NO2 in acetonitrile solution containing various concentration of acid, and simulated curves (red) fitted with exponential functions.
    Fig. 5. Kinetics (black) monitored at 450 nm obtained upon excitation of HO-Bp-NO2 in acetonitrile solution containing various concentration of acid, and simulated curves (red) fitted with exponential functions.
    pKa*=3.1 for 3Bp-NO2H+ obtained by using the dual-wavelength spectrophotometry measured at characteristic absorption bands at 625 (neutral T1) and 740 nm (triplet cation).
    Fig. 6. pKa*=3.1 for 3Bp-NO2H+ obtained by using the dual-wavelength spectrophotometry measured at characteristic absorption bands at 625 (neutral T1) and 740 nm (triplet cation).
    Kinetics (black) monitored at 650, 450 and 380 nm obtained in neat acetonitrile solution with different concentrations of HO-Bp-NO2, and simulated curves (red) fitted with exponential functions.
    Fig. 7. Kinetics (black) monitored at 650, 450 and 380 nm obtained in neat acetonitrile solution with different concentrations of HO-Bp-NO2, and simulated curves (red) fitted with exponential functions.
    (a) UV-visible absorption spectra of HO-Bp-NO2 in solutions containing MeCN:buffered water (9:1/v:v), and (b) pKa=10.7 for HO-Bp-NO2 obtained by using the dual-wavelength spectrophotometry measured at characteristic absorptions 328 and 426 nm.
    Fig. 8. (a) UV-visible absorption spectra of HO-Bp-NO2 in solutions containing MeCN:buffered water (9:1/v:v), and (b) pKa=10.7 for HO-Bp-NO2 obtained by using the dual-wavelength spectrophotometry measured at characteristic absorptions 328 and 426 nm.
    Table 1. Pseudo first order decay or/and growth time constants fitted with exponential functions at wavelengths of 660 and 450 nm obtained upon excitation of HO-Bp-NO2 in acetonitrile containing various concentration of acid.
    Table 2. Pseudo first order decay or/and growth time constants fitted with exponential functions at wavelengths of 650, 450 and 380 nm obtained in neat acetonitrile with different concentration of HO-Bp-NO2 in mol/L.
    Table 3. Fitted parameters in the rate constant equation, $ r_{ \rm{T}_1} $$ ^{\rm{a}} $=$ k $$ \times $[Q]+$ b $ (Q: acid or HO-Bp-NO2).
    Table 4. Vertical transitions predicted by TD-DFT calculations on the open-shell singlet of O-Bp-NO2H
    Jing Long, Zhao Ye, Yong Du, Xu-ming Zheng, Jia-dan Xue. Direct Observation of Transient Species Generated from Protonation and Deprotonation of the Lowest Triplet of p-Nitrophenylphenol[J]. Chinese Journal of Chemical Physics, 2020, 33(5): 635
    Download Citation