
Shi-Wen Xu, Yu-Ming Wei, Rong-Bin Su, Xue-Shi Li, Pei-Nian Huang, Shun-Fa Liu, Xiao-Ying Huang, Ying Yu, Jin Liu, Xue-Hua Wang. Bright single-photon sources in the telecom band by deterministically coupling single quantum dots to a hybrid circular Bragg resonator[J]. Photonics Research, 2022, 10(8): B1
- Photonics Research
- Vol. 10, Issue 8, B1 (2022)
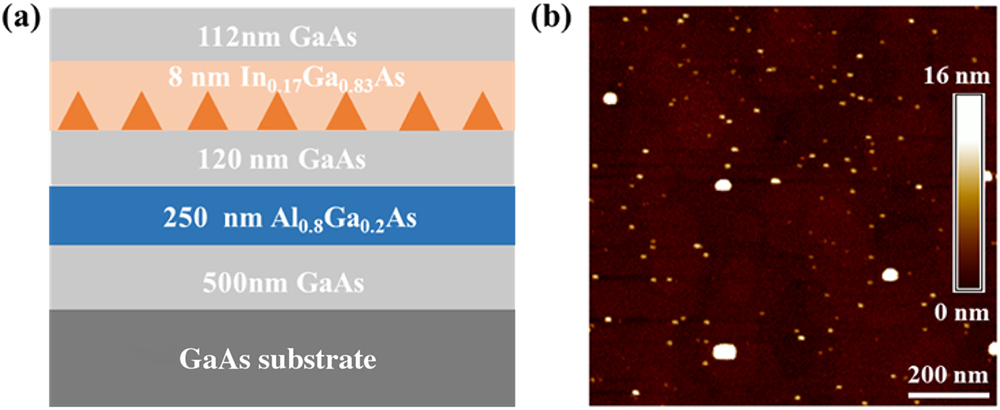
Fig. 1. Epitaxial growth of telecom band QDs. (a) Layer sequence of the investigated sample. (b) Representative AFM image of the QDs.
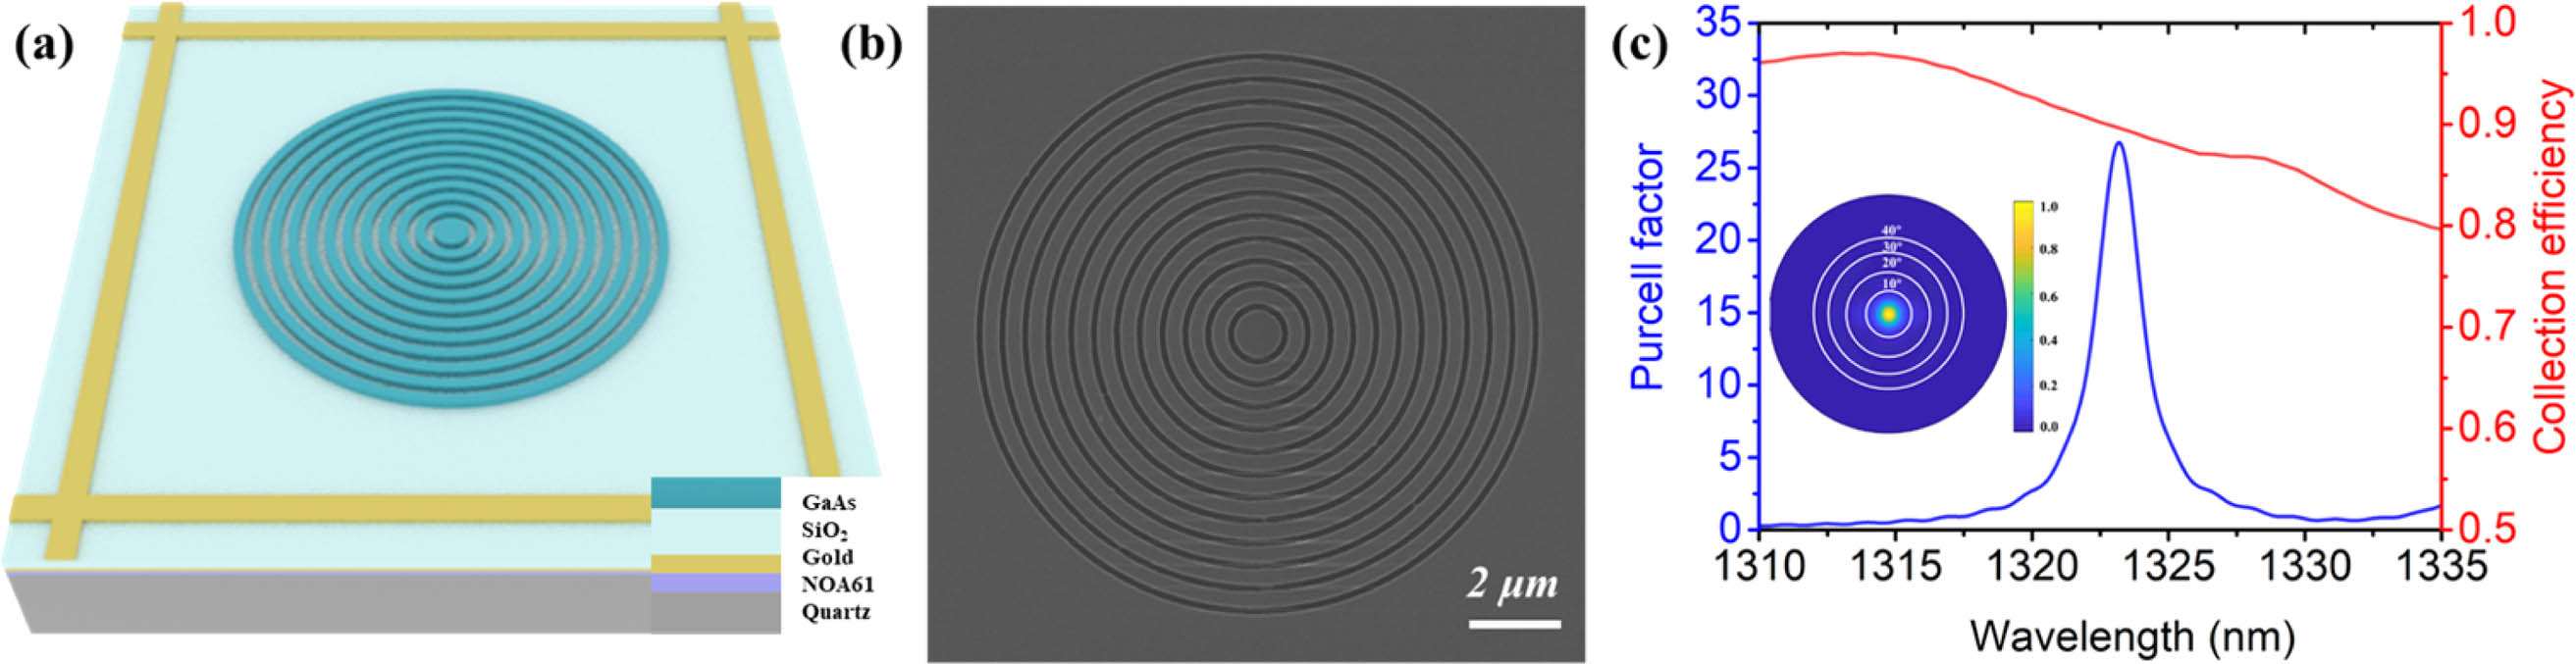
Fig. 2. h h h
Fig. 3. Deterministically coupled QD-CBR device. Fluorescence images (34 μm × 34 μm h p h
Fig. 4. Characterizations of the telecom band single-photon emissions. Autocorrelation measurements of single-photon emissions for (a) low-power (0.2 μW) and (b) high-power (4.8 μW) CW excitation. (c) Power dependences of the emission count rate and g ( 2 ) ( 0 ) g ( 2 ) ( 0 )
Fig. 5. Estimation of the extraction efficiency at the first lens. Left: schematic of the experimental setup (λ / 2 λ / 4

Set citation alerts for the article
Please enter your email address
© Copyright 2018-2021 | Chinese Laser Press. All Rights Reserved 沪ICP备15018463号-20