
Libang Mao, Yang Li, Guixin Li, Shuang Zhang, Tun Cao. Reversible switching of electromagnetically induced transparency in phase change metasurfaces[J]. Advanced Photonics, 2020, 2(5): 056004
- Advanced Photonics
- Vol. 2, Issue 5, 056004 (2020)
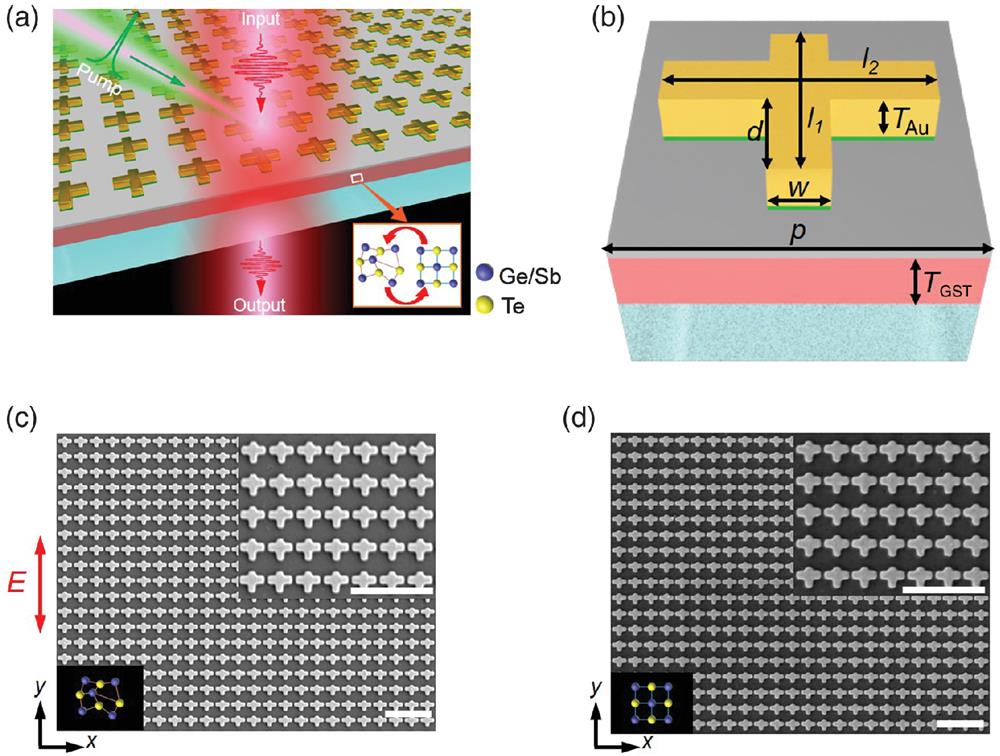
Fig. 1. Configuration of the EIT metasurface. (a) Schematic of the all-optical, nonvolatile, chalcogenide metamaterial induced EIT switch: single ns laser pulse transits a 35-nm-thick GST225 film, backward and forward between AM and CR on an area covering 510,000 antennae. (b) A representation of the resonator. The geometrical parameters are:
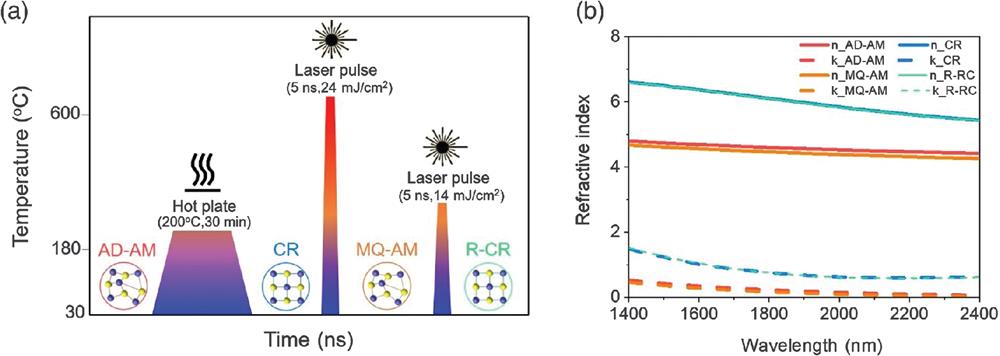
Fig. 2. Sequential treatment for the reversible phase transition. (a) Scheme of the reversible phase transition of the GST225 film hybridized with an EIT metasurface: AD-AM GST225 is first annealed above 180°C to change to CR GST225 using a hot plate. A single ns laser pulse (5 ns,
Fig. 3. Experimental realization of reversibly tunable EIT and the comparison with theory and simulation. (a) The FTIR measurement of the normalized transmittance spectra, (b) theoretical fitted transmittance spectra, and (c) numerical simulated transmittance spectra of the phase change metasurface with the different structural states of AD-AM, CR, MQ-AM, and R-CR.
Fig. 4. Bright and dark modes in EIT. The FDTD simulated spectra and
Fig. 5. The
Fig. 6. (a)–(c) Measured transmittance spectra of the phase change metasurface for 30 switching times. (d) The values of resonance peaks for AM (indicated by red dots) and CR (indicated by blue dots) states with 30 transition times.

Set citation alerts for the article
Please enter your email address
© Copyright 2018-2021 | Chinese Laser Press. All Rights Reserved 沪ICP备15018463号-20