
Qing Qi, Jichang Guo, Shanji Chen. Blind Image Deblurring Based on Image Edge Determination Mechanism[J]. Laser & Optoelectronics Progress, 2020, 57(24): 241022
- Laser & Optoelectronics Progress
- Vol. 57, Issue 24, 241022 (2020)
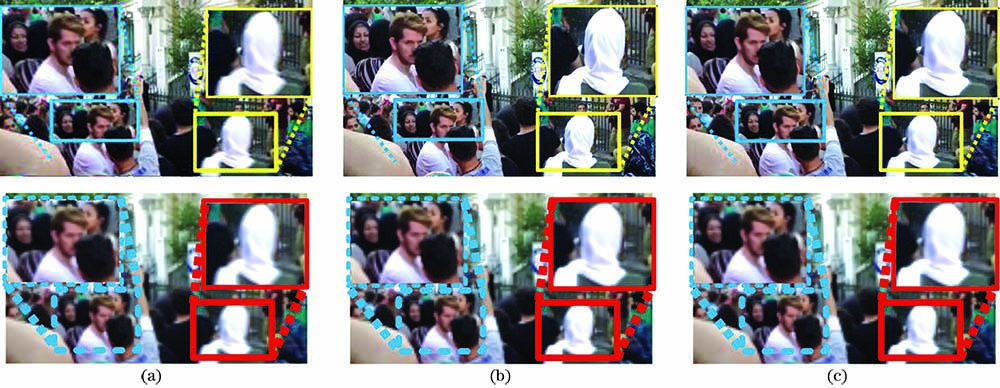
Fig. 1. Blurry image, clean image, and edge-weakened image. (a) Blurry image; (b) clean image; (c) edge-weakened image learned by PNet
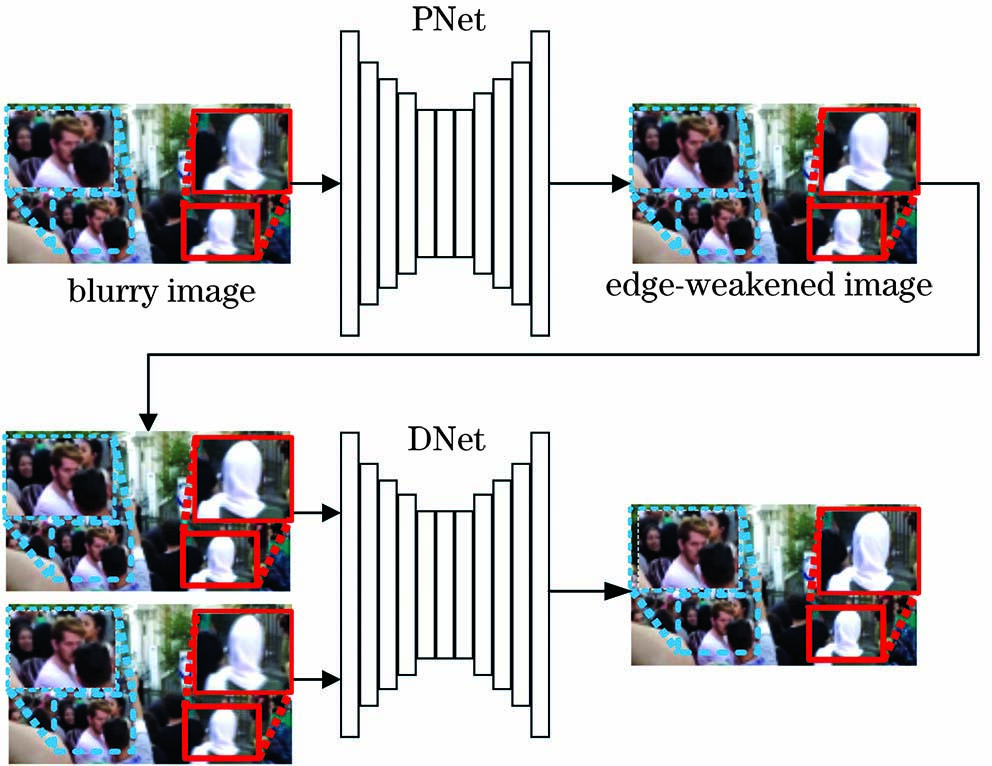
Fig. 2. Structure of proposed network
Fig. 3. Diagram of DNet subnet generator for image deblurring
Fig. 4. Dense residual block
Fig. 5. Diagram of PNet subnet discriminator (PatchGAN) for image deblurring
Fig. 6. Results of image deblurring of compared methods on test dataset of GOPRO. (a) Blurry images; (b) method in Ref. [11]; (c) method in Ref. [13]; (d) method in Ref. [15]; (e) method in Ref. [16]; (f) ours
Fig. 7. Results of image deblurring of compared methods on dataset of K?hler. (a) Blurry images; (b) method in Ref. [11]; (c) method in Ref. [13]; (d) method in Ref. [15]; (e) method in Ref. [16]; (f) ours
Fig. 8. Results of deblurring of compared methods for real blurred images. (a) Blurry images;(b) method in Ref. [11]; (c) method in Ref. [13];(d) method in Ref. [15];(e) method in Ref. [16];(f) ours
Fig. 9. Visual results of subnetworks on GOPRO test set. (a) Blurry input; results of (b) w/o content, (c) w/o edge, (d) w/o adv, (e) w/o PNet, and (f) proposed method
| ||||||||||||||||||||||||||||||||||
Table 1. Quantitative evaluation results of proposed method and compared methods on GOPRO and K?hler datasets
|
Table 2. Quantitative evaluation results on dataset of GOPRO with different subnetworks
|
Table 3. Quantitative evaluation results on dataset of GOPRO for different loss functions
|
Table 4. Quantitative evaluation results of proposed method and compared methods on dataset of GOPRO

Set citation alerts for the article
Please enter your email address
© Copyright 2018-2021 | Chinese Laser Press. All Rights Reserved 沪ICP备15018463号-20