• Acta Optica Sinica
  • Vol. 43, Issue 5, 0505001 (2023)
Yingyi Liu and Jing Cheng*
Author Affiliations
  • School of Physics and Optoelectronics, South China University of Technology, Guangzhou 510641, Guangdong, China
  • show less
    DOI: 10.3788/AOS221706 Cite this Article Set citation alerts
    Yingyi Liu, Jing Cheng. Two-Dimensional Talbot Effect in Uniaxial Crystals Orthogonal to Optical Axis[J]. Acta Optica Sinica, 2023, 43(5): 0505001 Copy Citation Text show less
    Intensity pattern and spatial spectrum of 2D sinusoidal grating (px=py=40 μm). (a) Intensity distribution; (b) spatial spectrum
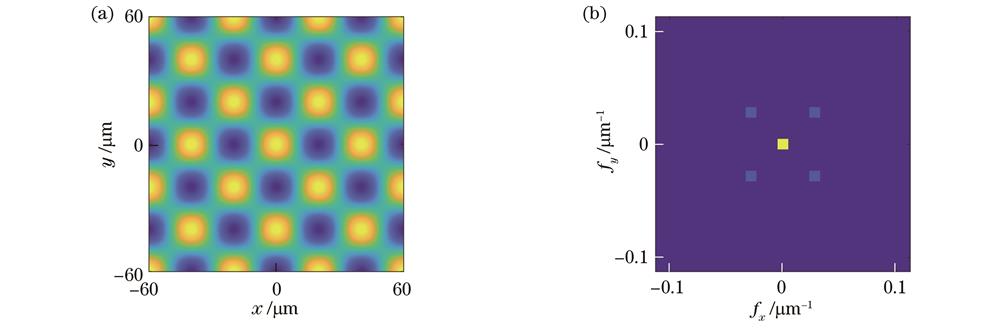
    Fig. 1. Intensity pattern and spatial spectrum of 2D sinusoidal grating (px=py=40 μm). (a) Intensity distribution; (b) spatial spectrum
    Intensity patterns and phase patterns of 2D sinusoidal grating at different positions. (a) Intensity pattern at z=zRT=6.578 mm; (b) intensity pattern at z=zRT/2 (corresponding to zRHT); (c) intensity pattern at z=zRT/4 (corresponding to zRQT when q is odd); (d) intensity pattern at z=3zRT/4 (corresponding to zRQT'when q is even); (e) phase pattern at z=zRT/4; (f) phase pattern at z=3zRT/4
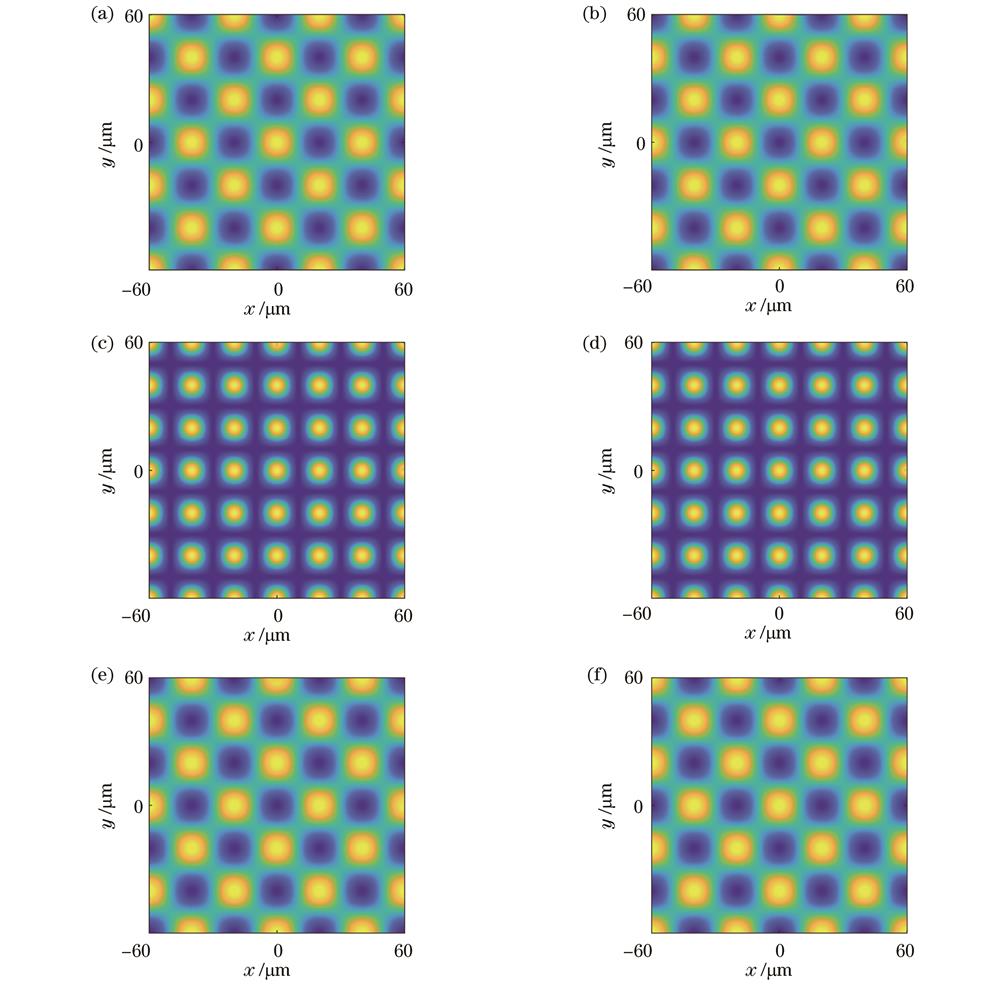
    Fig. 2. Intensity patterns and phase patterns of 2D sinusoidal grating at different positions. (a) Intensity pattern at z=zRT=6.578 mm; (b) intensity pattern at z=zRT/2 (corresponding to zRHT); (c) intensity pattern at z=zRT/4 (corresponding to zRQT when q is odd); (d) intensity pattern at z=3zRT/4 (corresponding to zRQT'when q is even); (e) phase pattern at z=zRT/4; (f) phase pattern at z=3zRT/4
    Variation of relative intensity and phase contrasts of 2D sinusoidal grating in reduced Talbot distance (α=0.98,0.90,0.70). (a) Relative intensity contrast; (b) phase contrast
    Fig. 3. Variation of relative intensity and phase contrasts of 2D sinusoidal grating in reduced Talbot distance (α=0.98,0.90,0.70). (a) Relative intensity contrast; (b) phase contrast
    Intensity pattern and spatial spectrum of 2D checker grating (px'= 32 μm, py'=95.64 μm). (a) Intensity distribution; (b) spatial spectrum
    Fig. 4. Intensity pattern and spatial spectrum of 2D checker grating (px'= 32 μm, py'=95.64 μm). (a) Intensity distribution; (b) spatial spectrum
    Intensity patterns and phase patterns of 2D checker grating at different positions. (a) Intensity pattern at z=zT=20.98 mm; (b) intensity pattern at z=zT/2 (corresponding to zHT); (c) intensity pattern at z=zT/4 (corresponding to zQTwhen q is odd); (d) intensity pattern at z=3zT/4 (corresponding to zQT' when q is even); (e) phase pattern at z=zT/4; (f) phase pattern at z=3zT/4
    Fig. 5. Intensity patterns and phase patterns of 2D checker grating at different positions. (a) Intensity pattern at z=zT=20.98 mm; (b) intensity pattern at z=zT/2 (corresponding to zHT); (c) intensity pattern at z=zT/4 (corresponding to zQTwhen q is odd); (d) intensity pattern at z=3zT/4 (corresponding to zQT' when q is even); (e) phase pattern at z=zT/4; (f) phase pattern at z=3zT/4
    Yingyi Liu, Jing Cheng. Two-Dimensional Talbot Effect in Uniaxial Crystals Orthogonal to Optical Axis[J]. Acta Optica Sinica, 2023, 43(5): 0505001
    Download Citation