• Journal of Inorganic Materials
  • Vol. 35, Issue 11, 1214 (2020)
Danlei TANG1, Lihua JIA1、*, Zhenlong ZHAO1, Rui YANG1, Xin WANG1, and Xiangfeng GUO1、2、*
Author Affiliations
  • 1College of Chemistry and Chemical Engineering, Qiqihar University, Qiqihar 161006, China
  • 2College of Chemistry, Guangdong Institute of Petrochemical Technology, Maoming 525000, China
  • show less
    DOI: 10.15541/jim20200025 Cite this Article
    Danlei TANG, Lihua JIA, Zhenlong ZHAO, Rui YANG, Xin WANG, Xiangfeng GUO. EDTA Assistant Preparation and Gas Sensing Properties of Co3O4 Nanomaterials[J]. Journal of Inorganic Materials, 2020, 35(11): 1214 Copy Citation Text show less
    Preparation process of Co3O4-E-450
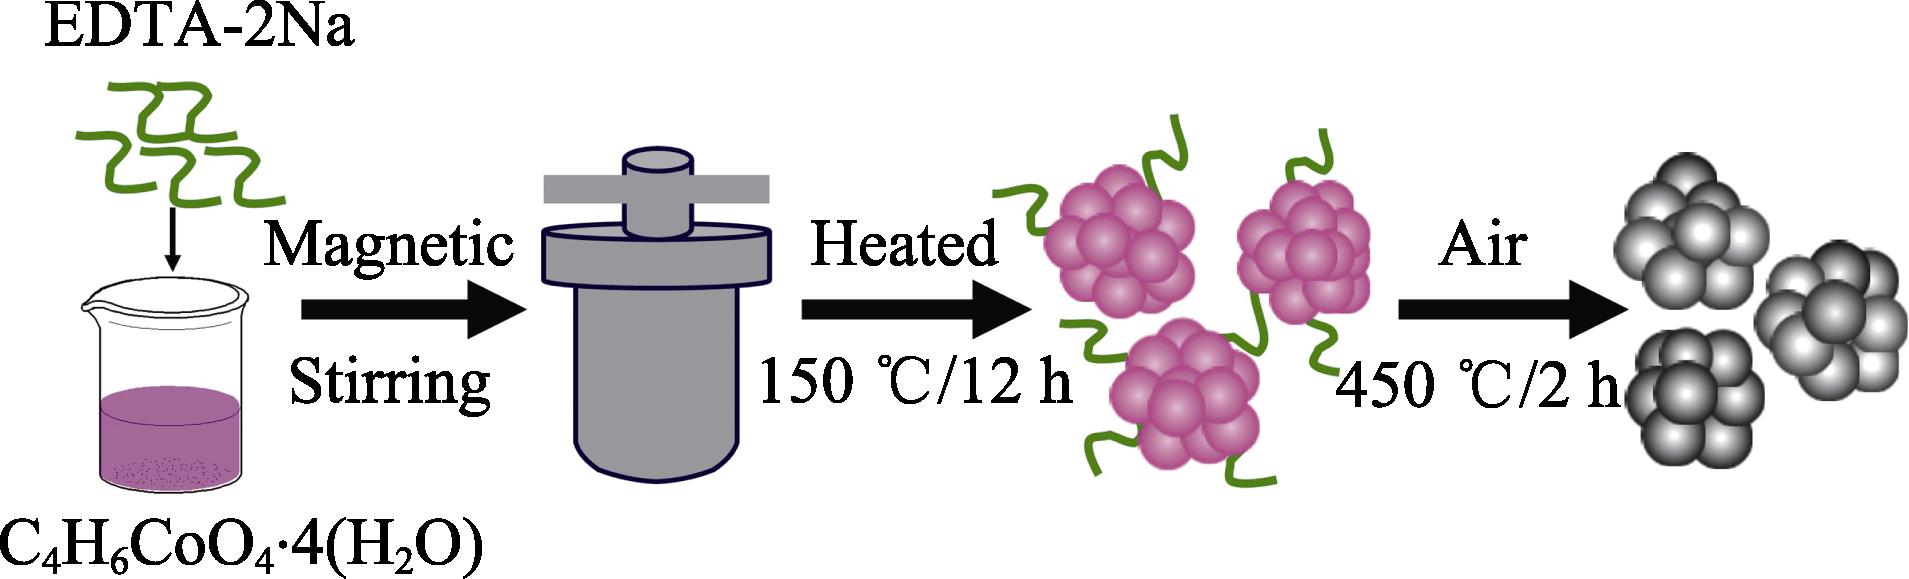
    1. Preparation process of Co3O4-E-450
    Structure schematic (a) and photo (b) of sample gas sensor real object, and the measurement electric circuit for the gas sensor (c)
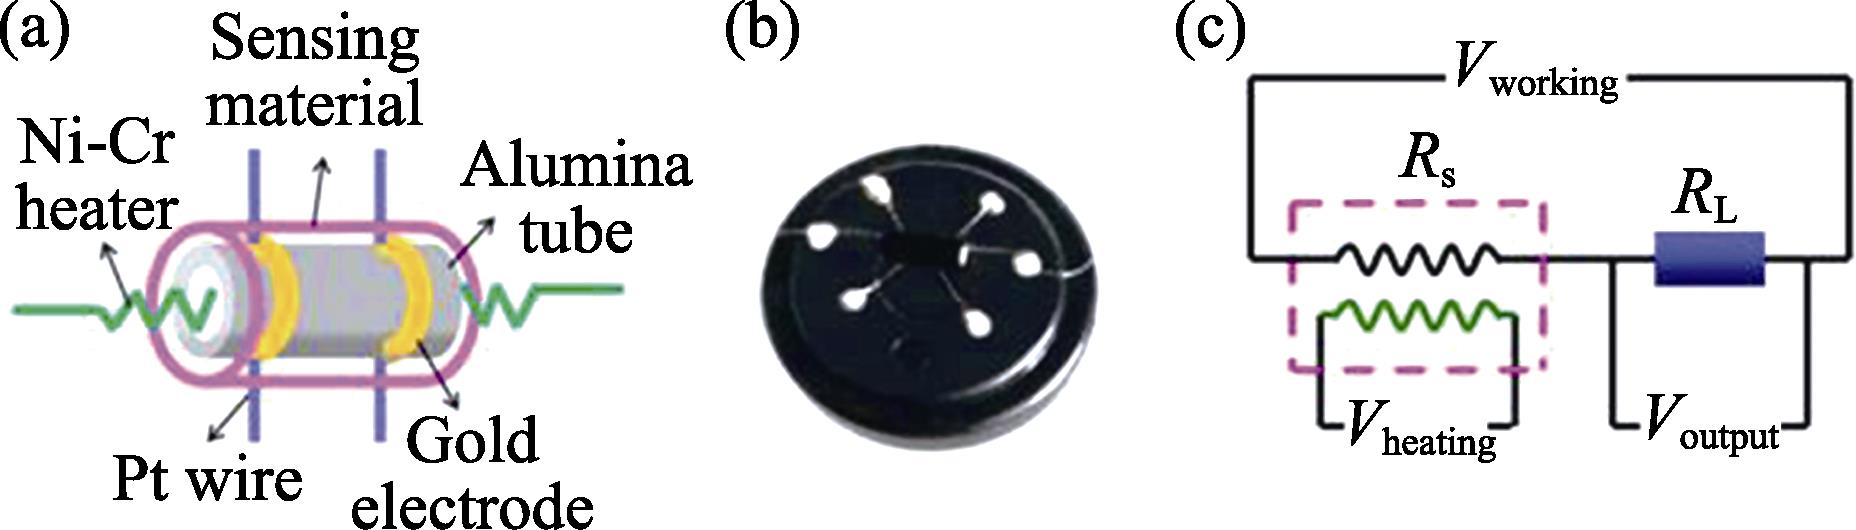
    2. Structure schematic (a) and photo (b) of sample gas sensor real object, and the measurement electric circuit for the gas sensor (c)
    TG-DSC curves of the obtained precursors Co3O4-E (a) and Co3O4-N (b)
    3. TG-DSC curves of the obtained precursors Co3O4-E (a) and Co3O4-N (b)
    XRD patterns of the precursors (a) and products Co3O4 (b)
    4. XRD patterns of the precursors (a) and products Co3O4 (b)
    N2 adsorption-desorpion isotherms (a) and pore size distributions (b) for Co3O4-E-450 and Co3O4-450
    5. N2 adsorption-desorpion isotherms (a) and pore size distributions (b) for Co3O4-E-450 and Co3O4-450
    Typical SEM, TEM and HRTEM images of Co3O4-E-450 (a, c, e), Co3O4-450 (b, d, f) Yellow ovals indicate the defects
    6. Typical SEM, TEM and HRTEM images of Co3O4-E-450 (a, c, e), Co3O4-450 (b, d, f) Yellow ovals indicate the defects
    FT-IR spectra of the precursor Co3O4-E, Co3O4-N and the products of Co3O4-E-450, Co3O4-450
    7. FT-IR spectra of the precursor Co3O4-E, Co3O4-N and the products of Co3O4-E-450, Co3O4-450
    Co2p (a) and O1s (b) XPS spectra of Co3O4-E-450 and Co3O4-450 and O1s XPS spectra of Co3O4-E-450 after sensing experiments to 100×10-6 toluene and 100×10-6 acetone (c)
    8. Co2p (a) and O1s (b) XPS spectra of Co3O4-E-450 and Co3O4-450 and O1s XPS spectra of Co3O4-E-450 after sensing experiments to 100×10-6 toluene and 100×10-6 acetone (c)
    UV-Vis spectra of Co3O4-E-450 and Co3O4-450 (a1-a2); (αhν)2versus hν curves of as-prepared Co3O4-E-450 and Co3O4-450 (b1-b2)
    9. UV-Vis spectra of Co3O4-E-450 and Co3O4-450 (a1-a2); (αhν)2versus hν curves of as-prepared Co3O4-E-450 and Co3O4-450 (b1-b2)
    Schematic of formation process of the as-prepared Co3O4 nanosheet
    10. Schematic of formation process of the as-prepared Co3O4 nanosheet
    Response of the gas sensors of Co3O4-E-450 and Co3O4-450 to 100×10-6 toluene (a) and 100×10-6 acetone (b) at working temperatures; Responses of the Co3O4-E-450 to 100×10-6 various gases at different operating temperatures (c); Dynamic response characterizations of Co3O4-E-450 towards 100×10-6 toluene (205 ℃) and 100×10-6 acetone (225 ℃) (d)
    11. Response of the gas sensors of Co3O4-E-450 and Co3O4-450 to 100×10-6 toluene (a) and 100×10-6 acetone (b) at working temperatures; Responses of the Co3O4-E-450 to 100×10-6 various gases at different operating temperatures (c); Dynamic response characterizations of Co3O4-E-450 towards 100×10-6 toluene (205 ℃) and 100×10-6 acetone (225 ℃) (d)
    Dynamic response-recovery curve of Co3O4-E-450-based sensor to different concentrations of toluene at 205 ℃ (a) and to different concentrations of acetone (b) at 225 ℃ Insets are the corresponding linear relation fitting curves
    12. Dynamic response-recovery curve of Co3O4-E-450-based sensor to different concentrations of toluene at 205 ℃ (a) and to different concentrations of acetone (b) at 225 ℃ Insets are the corresponding linear relation fitting curves
    Cyclic tests of the Co3O4-E-450 sensor to 100×10-6 of toluene at 205 ℃ (a) and 100×10-6 of acetone at 225℃ (b); Long term stability of the Co3O4-E-450 sensor to 100×10-6 and 0.5×10⁻⁶ of toluene at 205 ℃ (c) and 100×10-6 and 1×10⁻⁶ of acetone at 225 ℃ (d)
    13. Cyclic tests of the Co3O4-E-450 sensor to 100×10-6 of toluene at 205 ℃ (a) and 100×10-6 of acetone at 225℃ (b); Long term stability of the Co3O4-E-450 sensor to 100×10-6 and 0.5×10⁻⁶ of toluene at 205 ℃ (c) and 100×10-6 and 1×10⁻⁶ of acetone at 225 ℃ (d)
    SampleBET surface area/(m2·g-1)Average pore diameter/nmMean crystal size of Co3O4/nm
    Co3O4-E-45057.8411.1815.7
    Co3O4-45042.6310.6019.9
    Table 1. Structural performance parameters of the samples
    AddtiveGasesConcentration/×10-6Temperature/℃ResponseDetection limit/×10-6Ref.
    NoneH2S10030041[13]
    Nonen-butanol1000100900~50[14]
    C6H5Na3O7·2H2OAcetone100011136.520[17]
    CH3COOHAcetone1001606.15[18]
    EDTA-2NaToluene/Acetone100205/225104/700.5/1This work
    Table 2. Properties of various additive assisted synthesis Co3O4 semiconductor sensors
    Danlei TANG, Lihua JIA, Zhenlong ZHAO, Rui YANG, Xin WANG, Xiangfeng GUO. EDTA Assistant Preparation and Gas Sensing Properties of Co3O4 Nanomaterials[J]. Journal of Inorganic Materials, 2020, 35(11): 1214
    Download Citation