
Shangjun Yang, Xizheng Ke, Jiali Wu, Xuguang Liu. Fast Alignment of Wireless Optical Communication Using Two-Dimensional Mirror[J]. Chinese Journal of Lasers, 2022, 49(11): 1106001
- Chinese Journal of Lasers
- Vol. 49, Issue 11, 1106001 (2022)
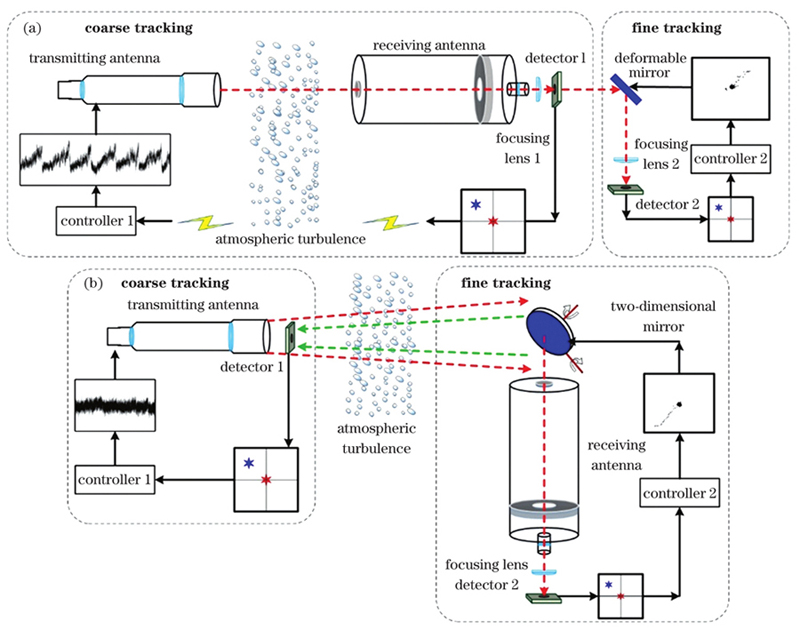
Fig. 1. Schematic of beam alignment of wireless optical communication. (a) Coaxial alignment; (b) two-dimensional mirror assisted alignment
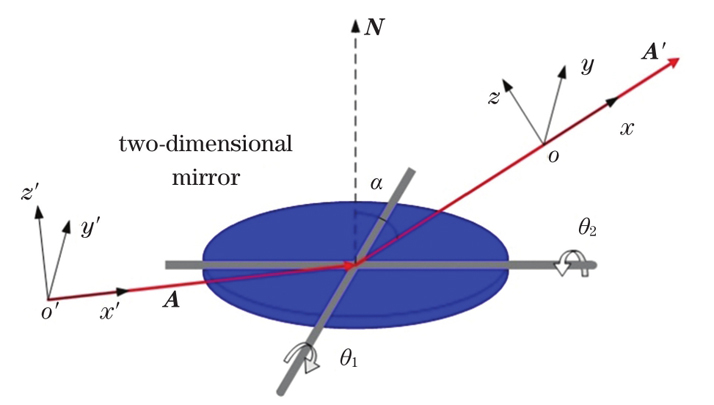
Fig. 2. Geometrical optical model of two-dimensional mirror
Fig. 3. Laser tracking algorithm block diagram using two-dimensional mirror
Fig. 4. Wireless optical communication IM/DD system with fast alignment of two-dimensional mirror
Fig. 5. Schematic of field experiment of wireless optical communication for 1.3 km. (a) Link diagram; (b) far field spot
Fig. 6. Schematic of beam fast calibration. (a) Structure diagram; (b) calibration camera interface
Fig. 7. Tracking curves of calibration camera system in 1.3 km field experiment under different adjustments. (a) Pitch adjustment; (b) azimuth adjustment
Fig. 8. Trajectories of outgoing spot under different incident angles and scanning angles. (a) α=10°,θ1=-1°1°,θ2=-5°5°;(b) α=30°,θ1=-1°1°,θ2=-5°5°;(c) α=10°,θ1=-1°1°,θ2=-10°10°;(d) α=10°,θ1=-2°2°,θ2=-5°5°
Fig. 9. Power spectral density of spot center drift in 1.3 km field experiment. (a) x direction; (b) y direction
Fig. 10. Tracking waveforms in 1.3 km field experiment. (a) Tracking curve; (b) track curves along x and y directions; (c) power spectral density along x direction; (d) power spectral density along y direction
Fig. 11. Signal waveforms at 1.3 km communication link. (a) Transmitting signal; (b) receiving signal
Fig. 12. Schematic of wireless optical communication system in 10.3 km field experiment. (a) Link diagram; (b) far field spot
Fig. 13. Tracking curves detected by calibration camera in 10.3 km field experiment. (a) Pitch adjustment; (b) azimuth adjustment
Fig. 14. Bidirectional alignment schematic in 10.3 km experiment. (a) System schematic; (b) transmitting end; (c) receiving end
Fig. 15. Results of 10.3 km bidirectional alignment experiment. (a) Downlink transmission signal waveform; (b) uplink detection spot
Fig. 16. Power spectral density of spot center drift in 10.3 km field experiment. (a) x direction; (b) y direction
Fig. 17. Tracking waveforms in 10.3 km field experiment. (a) Tracking curve; (b) track curves along x and y directions; (c) power spectral density along x direction; (d) power spectral density along y direction
Fig. 18. Signal waveforms at 10.3 km communication link. (a) Transmitting signal; (b) receiving signal
|
Table 1. Experimental equipment and parameters

Set citation alerts for the article
Please enter your email address
© Copyright 2018-2021 | Chinese Laser Press. All Rights Reserved 沪ICP备15018463号-20