Author Affiliations
1East China Normal University, Joint Institute of Advanced Science and Technology, School of Physics and Electronic Science, State Key Laboratory of Precision Spectroscopy, Shanghai, China2CAS Center for Excellence in Ultra-intense Laser Science, Shanghai, China3Zhejiang University, Department of Physics, Hangzhou, China4Shanxi University, Collaborative Innovation Center of Extreme Optics, Taiyuan, Chinashow less
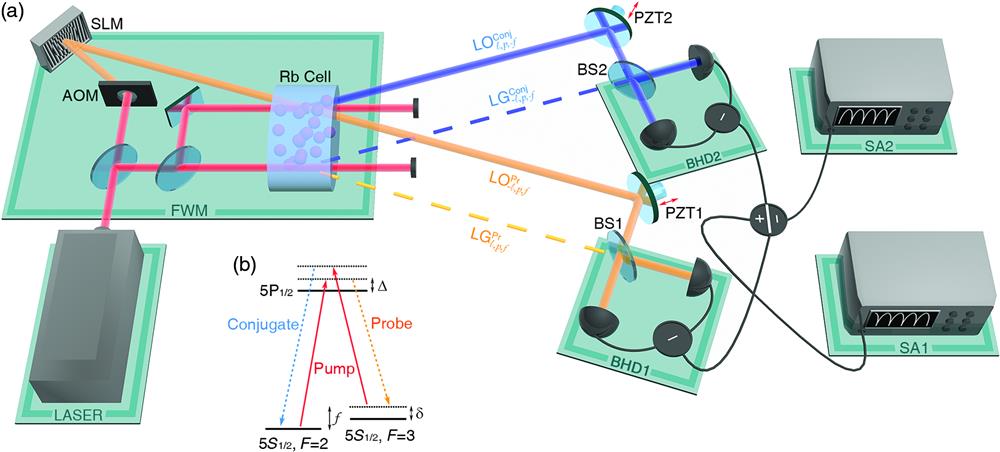
Fig. 1. Experimental setup for generation and verification of large-scale CV hyperentanglement in three DOFs. (a) Two similar FWM processes happen in a vapor cell, one of which is seeded with a probe beam modulated by an AOM and an SLM. The seeded FWM process generates the LOs of the two BHDs for extracting the desired modes generated from the unseeded FWM process. Two scanned PZTs are used to change the phases of the two BHDs for measuring the desired field quadrature. The photocurrents of the two BHDs are recorded by two SAs. AOM: acousto-optic modulator; BHD1 and BHD2: balanced homodyne detections; BS1 and BS2: 50:50 beam splitters; LO: local oscillator; PZT1 and PZT2: piezoelectric actuators; Rb cell: hot vapor cell; SA1 and SA2: spectrum analyzers; SLM: spatial light modulator. (b) The energy level diagram of the double- configuration in the D1 line of . : one-photon detuning; : two-photon detuning; : frequency shifting from pump beam.
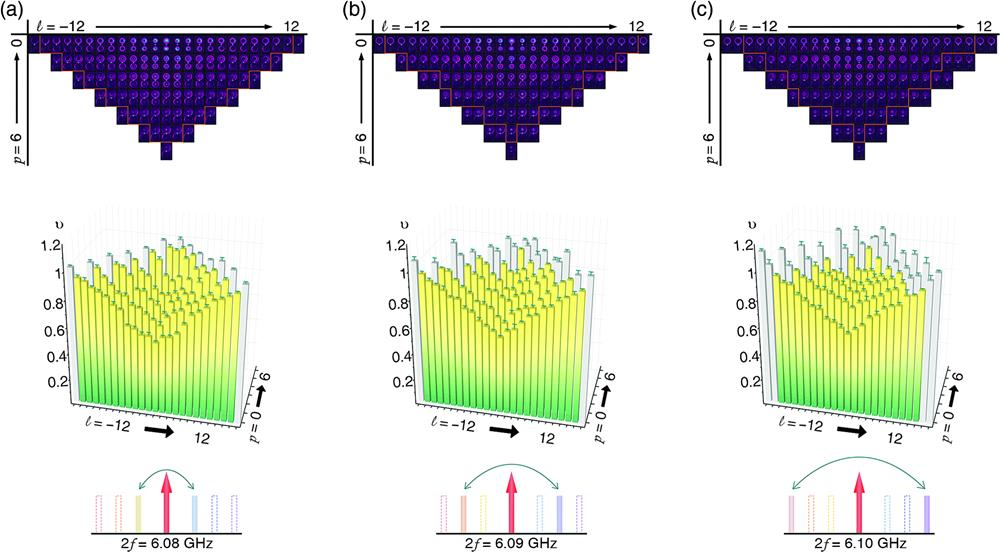
Fig. 2. Experimental results for verifying large-scale CV hyperentanglement in three DOFs. 91 pairs of LG modes are measured at different frequencies with (a) , (b) , and (c) . The upper panel of each subfigure shows the CCD captured images of LG modes generated from the FWM process with varying quantum numbers of azimuthal index and radial index . Labeled columns represent the azimuthal index of the probe beam, while labeled rows represent the radial index of the probe beam. The entangled LG modes are enclosed inside the orange frame. The middle panel of each subfigure shows the smallest symplectic eigenvalue of the partially transposed covariance matrix as a function of the two quantum numbers and , respectively. The lower panel of each subfigure indicates the frequency of hyperentangled LG modes.
Fig. 3. Experimental results for verifying CV entanglement between coherent LG superposition modes considering both azimuthal and radial quantum numbers in the case of . (a) The theoretical intensity profile (top row) and phase pattern (bottom row) of the mode. (b) The CCD captured image of the entangled mode and mode. (c) The theoretical intensity profile and phase pattern of the mode. (d) The theoretical intensity profile and phase pattern of the mode. (e) The CCD captured images of the mode and the mode for varying from 1 to 8. The entangled modes are enclosed inside the orange frame. (f) The CCD captured images of the mode and the mode for varying from 1 to 8. (g) The measured smallest symplectic eigenvalue as a function of for and modes. (h) The measured smallest symplectic eigenvalue as a function of for and modes.