• Photonics Research
  • Vol. 9, Issue 2, B38 (2021)
Zhenyu Li1、2、†, Hui Zhang2、†, Binh Thi Thanh Nguyen2, Shaobo Luo2, Patricia Yang Liu2, Jun Zou2, Yuzhi Shi2, Hong Cai3, Zhenchuan Yang1, Yufeng Jin1, Yilong Hao1、5、*, Yi Zhang2、4、6、*, and Ai-Qun Liu2、7、*
Author Affiliations
  • 1National Key Laboratory of Science and Technology on Micro/Nano Fabrication, Institute of Microelectronics, Peking University, Beijing 100871, China
  • 2Quantum Science and Engineering Centre, Nanyang Technological University, Singapore 639798, Singapore
  • 3Institute of Microelectronics, A*STAR (Agency for Science, Technology and Research), Singapore 138634, Singapore
  • 4School of Mechanical and Aerospace Engineering, Nanyang Technological University, Singapore 639798, Singapore
  • 5e-mail: haoyl@pku.edu.cn
  • 6e-mail: yi_zhang@ntu.edu.sg
  • 7e-mail: eaqliu@ntu.edu.sg
  • show less
    DOI: 10.1364/PRJ.411825 Cite this Article Set citation alerts
    Zhenyu Li, Hui Zhang, Binh Thi Thanh Nguyen, Shaobo Luo, Patricia Yang Liu, Jun Zou, Yuzhi Shi, Hong Cai, Zhenchuan Yang, Yufeng Jin, Yilong Hao, Yi Zhang, Ai-Qun Liu. Smart ring resonator–based sensor for multicomponent chemical analysis via machine learning[J]. Photonics Research, 2021, 9(2): B38 Copy Citation Text show less
    Schematic illustration of smart sensor framework. (a) Acquisition of resonant spectrum using ring resonator–based smart sensor. (b) Resonant spectra are collected into a data library. (c) Transformation of resonant spectra to matrices. (d) Neural network training with transformed resonant spectra. (e) Composition prediction with neural network model.
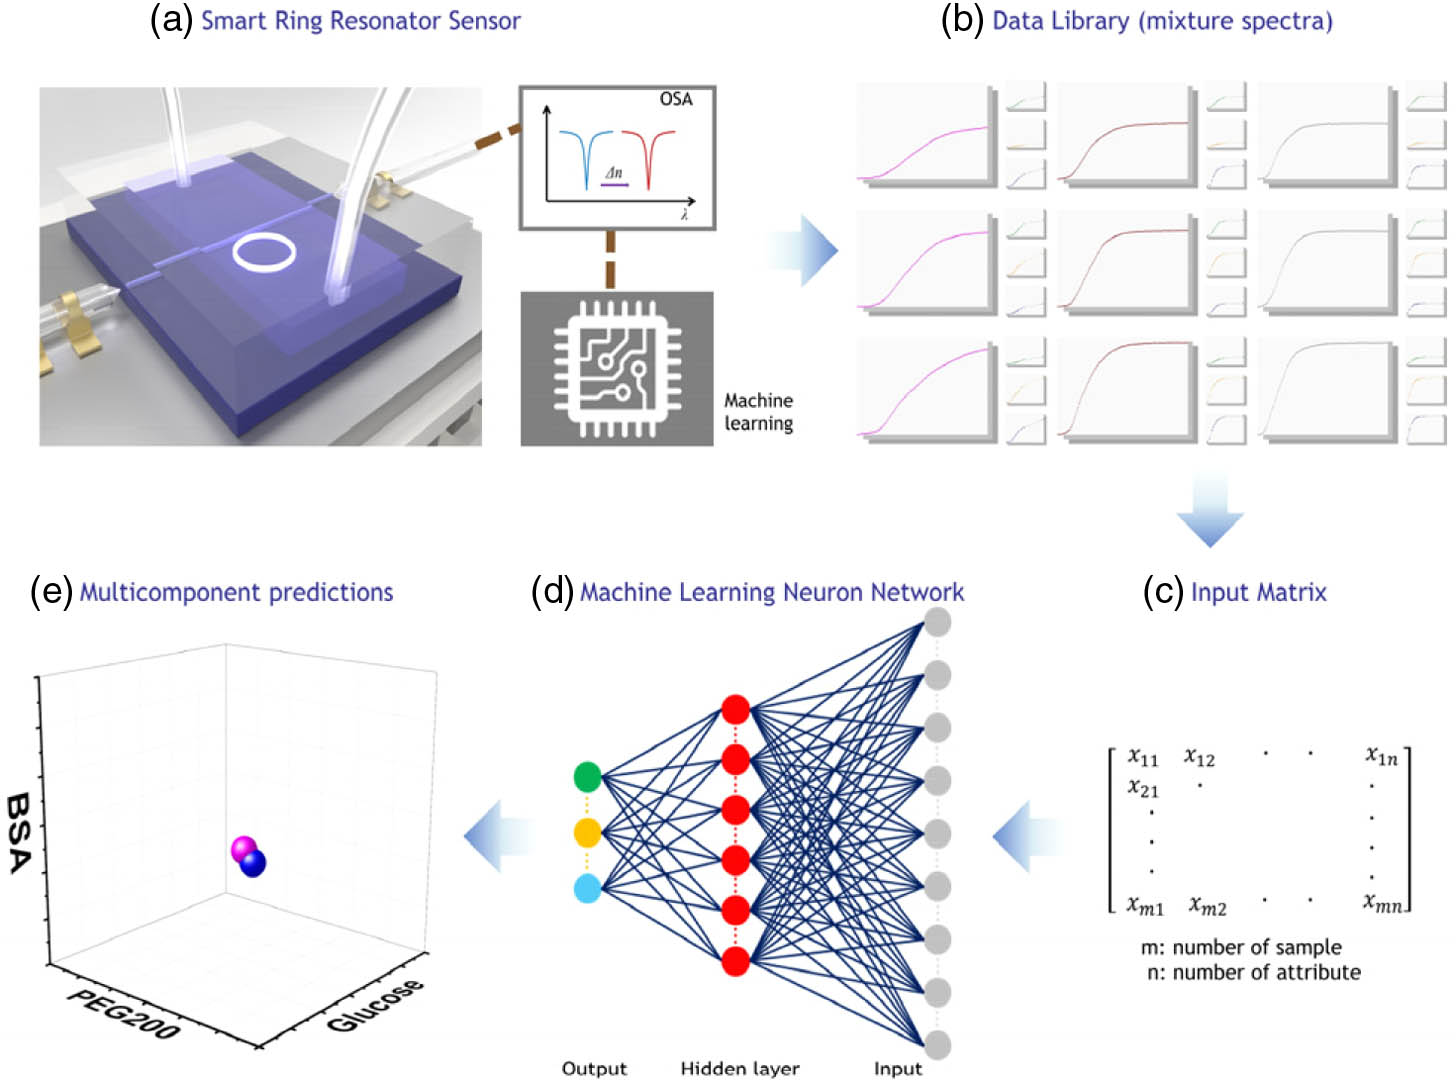
    Fig. 1. Schematic illustration of smart sensor framework. (a) Acquisition of resonant spectrum using ring resonator–based smart sensor. (b) Resonant spectra are collected into a data library. (c) Transformation of resonant spectra to matrices. (d) Neural network training with transformed resonant spectra. (e) Composition prediction with neural network model.
    Neural network of the smart sensor. (a) The resonant spectrum of an unknown sample mixture is acquired with the ring resonator and fed into the trained neural network. The number of neurons in the input, hidden, and output layers is 160, 64, 36, respectively. The 36 attributes of the output are divided into three groups, each with 12 attributes. Each group of 12 attributes is used to predict the concentration of one component in the mixture. The composition of the unknown sample is determined by the predicted concentrations of all three components. (b) Cost function versus training interactions for samples at 10 μL/min as an example.
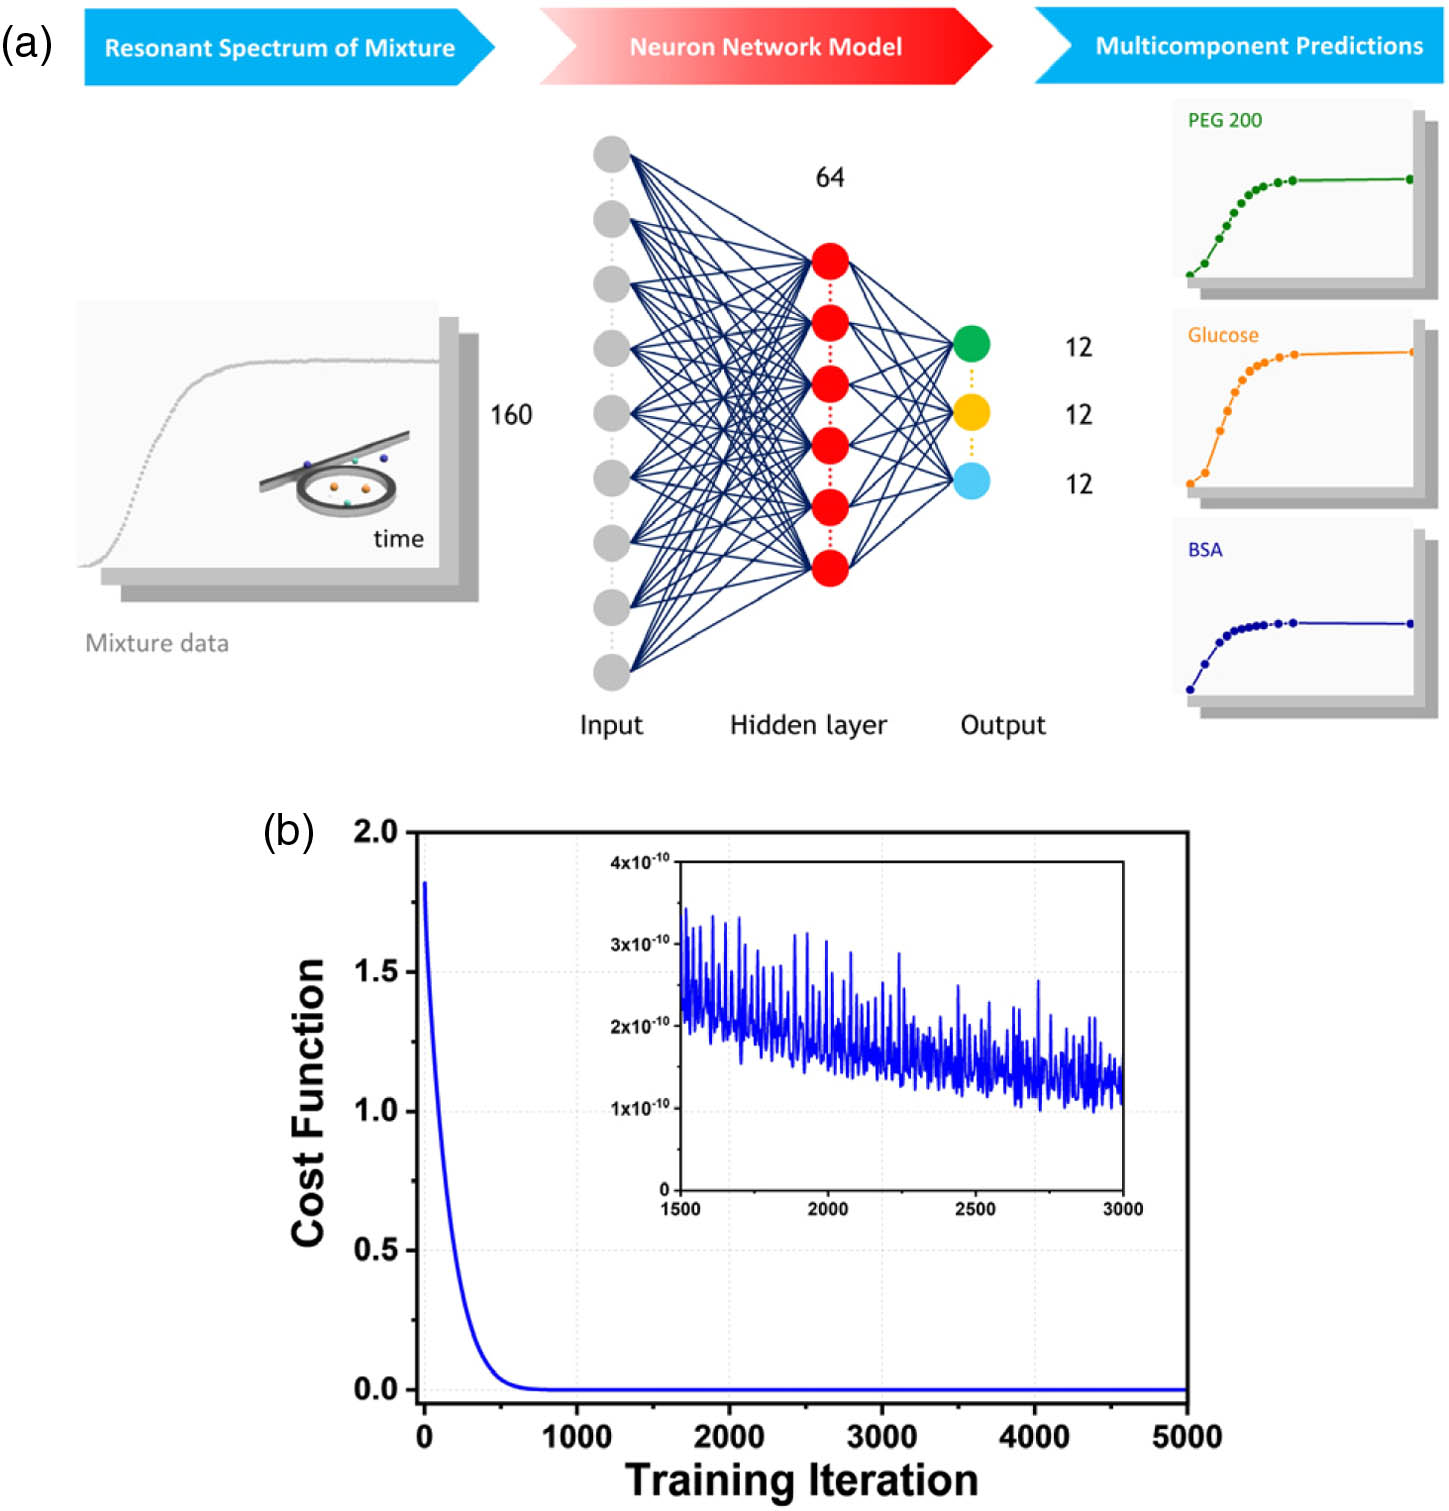
    Fig. 2. Neural network of the smart sensor. (a) The resonant spectrum of an unknown sample mixture is acquired with the ring resonator and fed into the trained neural network. The number of neurons in the input, hidden, and output layers is 160, 64, 36, respectively. The 36 attributes of the output are divided into three groups, each with 12 attributes. Each group of 12 attributes is used to predict the concentration of one component in the mixture. The composition of the unknown sample is determined by the predicted concentrations of all three components. (b) Cost function versus training interactions for samples at 10 μL/min as an example.
    Resonant spectra measured by the ring resonator under various conditions. (a)–(c) Resonator spectra for PEG200, glucose, and BSA solution under a constant flow rate of 30 μL/min. The concentration ranges from 0 to 30 mg/mL with an increment of 5 mg/mL. (d)–(f) Resonator spectra for PEG200, glucose, and BSA solution under a constant concentration of 20 mg/mL. The flow rate ranges from 10 to 90 μL/min with an increment of 20 μL/min. (g) For the resonant spectrum of the mixture with 15 mg/mL PEG200, 5 mg/mL glucose, and 15 mg/mL BSA at 50 μL/min flow rate; (h) for the resonant spectrum of the mixture with 25 mg/mL PEG200, 5 mg/mL glucose, and 5 mg/mL BSA at 50 μL/min flow rate; and (i) for the resonant spectrum of the mixture with 20 mg/mL PEG200, 10 mg/mL glucose, and 5 mg/mL BSA at 50 μL/min flow rate.
    Fig. 3. Resonant spectra measured by the ring resonator under various conditions. (a)–(c) Resonator spectra for PEG200, glucose, and BSA solution under a constant flow rate of 30 μL/min. The concentration ranges from 0 to 30 mg/mL with an increment of 5 mg/mL. (d)–(f) Resonator spectra for PEG200, glucose, and BSA solution under a constant concentration of 20 mg/mL. The flow rate ranges from 10 to 90 μL/min with an increment of 20 μL/min. (g) For the resonant spectrum of the mixture with 15 mg/mL PEG200, 5 mg/mL glucose, and 15 mg/mL BSA at 50 μL/min flow rate; (h) for the resonant spectrum of the mixture with 25 mg/mL PEG200, 5 mg/mL glucose, and 5 mg/mL BSA at 50 μL/min flow rate; and (i) for the resonant spectrum of the mixture with 20 mg/mL PEG200, 10 mg/mL glucose, and 5 mg/mL BSA at 50 μL/min flow rate.
    Composition predicted by the neural network model. (a) 3D distribution of the prediction composition and the ground truth (10 representative points). (b) Histogram of prediction error (RMSE) for all 114 samples in the testing dataset.
    Fig. 4. Composition predicted by the neural network model. (a) 3D distribution of the prediction composition and the ground truth (10 representative points). (b) Histogram of prediction error (RMSE) for all 114 samples in the testing dataset.
    Predicted concentration versus expected concentration (ground truth) for (a) PEG200, (b) glucose, and (c) BSA.
    Fig. 5. Predicted concentration versus expected concentration (ground truth) for (a) PEG200, (b) glucose, and (c) BSA.
    SEM of the fabricated microring resonator.
    Fig. 6. SEM of the fabricated microring resonator.
    Flow Rate (μL/min)PEG200 (mg/mL)Glucose (mg/mL)BSA (mg/mL)Prediction Error RMSE (mg/mL)
    1015.45.914.80.58
    3015.74.615.30.50
    5015.06.014.30.70
    7014.64.914.60.33
    9014.35.114.80.42
    Average15.05.314.80.21
    Table 1. Representative Sample 1 Composition Prediction under Different Experiment Conditionsa
    Flow Rate (μL/min)PEG200 (mg/mL)Glucose (mg/mL)BSA (mg/mL)Prediction Error RMSE (mg/mL)
    1020.725.715.80.73
    3021.524.615.81.01
    5020.425.514.60.44
    7019.925.213.90.65
    9019.525.014.20.54
    Average20.425.314.90.29
    Table 2. Representative Sample 2 Composition Prediction under Different Experiment Conditionsa
    Flow Rate (μL/min)PEG200 (mg/mL)Glucose (mg/mL)BSA (mg/mL)Prediction Error RMSE (mg/mL)
    1021.110.44.10.85
    3020.610.15.30.39
    5019.611.44.80.85
    7019.410.35.40.45
    9019.49.75.30.42
    Average20.010.45.00.23
    Table 3. Representative Sample 3 Composition Prediction under Different Experiment Conditionsa
    Zhenyu Li, Hui Zhang, Binh Thi Thanh Nguyen, Shaobo Luo, Patricia Yang Liu, Jun Zou, Yuzhi Shi, Hong Cai, Zhenchuan Yang, Yufeng Jin, Yilong Hao, Yi Zhang, Ai-Qun Liu. Smart ring resonator–based sensor for multicomponent chemical analysis via machine learning[J]. Photonics Research, 2021, 9(2): B38
    Download Citation