We demonstrate a smart sensor for label-free multicomponent chemical analysis using a single label-free ring resonator to acquire the entire resonant spectrum of the mixture and a neural network model to predict the composition for multicomponent analysis. The smart sensor shows a high prediction accuracy with a low root-mean-squared error ranging only from 0.13 to 2.28 mg/mL. The predicted concentrations of each component in the testing dataset almost all fall within the 95% prediction bands. With its simple label-free detection strategy and high accuracy, the smart sensor promises great potential for multicomponent analysis applications in many fields.
1. INTRODUCTION
Ring resonators are in an emerging class of versatile and highly sensitive photonic sensors that use recirculating light confined within a microcavity to detect the changes in surrounding biological, physical, and chemical environments [1–3]. They are well suited for integrated sensing systems because of their high sensitivity, compact size, label-free detection, real-time monitoring capability, low sample consumption, multiplexing capability, and resistance to electromagnetic interference [4,5]. Ring resonators could be easily fabricated into a large array for multiplexed detection. In theory, each individually addressable ring resonator in the array could be labeled with a unique capture agent to detect a specific target of interest in a mixture [6]. The capture agent labeled on the ring resonator ensures the sensing specificity. However, this approach presents a practical challenge—the ring resonators would be so closely spaced in the array that it would be impractical to selectively label each ring resonator while avoiding contaminating the adjacent ones without employing expensive and bulky microdispensers [7]. Therefore, a simple unlabeled multiplexed detection strategy is highly desired for ring resonator–based sensors. Indeed, the ring resonator is well recognized for its capability of label-free sensing. When target molecules come into proximity of the ring resonator, the resonant peak shifts to a different wavelength, and the degree of this resonant shift reflects the target concentration. This label-free sensing strategy works well for single-component analysis but shows poor performance for multicomponent analysis due to its lack of specificity. With the endpoint measurement of the resonant peak shift as the only parameter for sensing, the ring resonator is incapable of distinguishing a specific component from a mixture. One conventional solution to this problem is to extract the component of interest from the mixture and measure all components one at a time. However, the extraction processes are often tedious, laborious, and time-consuming [8]. Moreover, not all components can be extracted from a mixture. A more popular approach of multicomponent analysis is based on multivariant calibration of spectral information obtained by using UV spectrophotometry, Raman spectroscopy, nuclear magnetic resonance spectroscopy, and other kinds of spectroscopy [9–11]. This approach requires a large database containing the spectra of each individual component in their pure forms. To identify all components, the superimposed spectrum of the mixture is decomposed into the spectra of individual components using algorithms such as multiple linear regression, principle component regression, and partial least squares [12,13]. One major assumption made by this approach is that the spectrum of the mixture is a linear superposition of the spectra of individual components, which is not always substantiated. This approach also has difficulty in identifying components with substantial overlapping spectra and indistinguishable features. Although several models have been proposed to distinguish those spectra by introducing additional handcrafted features, they have not been widely adopted in practice [14,15].
Instead of using features handcrafted by users, machine learning identifies characteristic features from the dataset on its own. It is able to build data-driven models with its unique learning ability. In recent years, machine learning, especially deep learning [16], has received a lot of attention and has redefined data science [17,18]. The rapid development of machine learning has enabled a wide range of data-driven sensing applications. For example, research in drug discovery and development employs machine learning to explore the causal association between drugs, biomarkers, and diseases [19,20], which promotes data-driven decision-making and has the potential to speed up drug development and reduce failure rates. Machine learning is also used to predict drug–drug interactions during clinical trials, which reduces adverse drug reactions and healthcare costs [21]. Machine learning has also become a crucial technique for device and material development [22–25]. Researchers have attempted to optimize the design of metamaterial on demand with machine learning [26–28]. Various types of sensors, such as microring resonators and surface plasmon resonance–based sensors [29,30], have benefited from machine learning. Machine learning is employed to boost the selectivity of gas sensors [31] and improve the performance of low-cost and mobile plasmonic sensing platforms by reducing the inter-device variability [32].
In this paper, we demonstrate a machine learning–enabled smart sensor based on a ring resonator for multicomponent chemical analysis. The smart sensor integrates a ring resonator and microfluidic network onto a single chip using silicon photonic fabrication technology. Instead of using an array of ring resonators selectively labeled with capture agents for multiplexing, a single label-free ring resonator is used to sense all components of interest in a mixture by analyzing the resonant spectrum of the mixture using a machine learning model. The machine learning model based on artificial neural network is trained to decompose the resonant spectrum of the mixture into spectra of the individual components. Instead of solely relying on the resonant peak shift, the machine learning algorithm extracts features from the entire spectrum for target identification and quantification. As a proof of concept, we have accurately quantified glucose, polyethylene glycol (PEG) 200, and bovine serum albumin (BSA) mixed at arbitrary ratios using this smart sensor with a low root-mean-squared error (RMSE) ranging only from 0.13 to 2.28 mg/mL over the tested range of 0–30 mg/mL. The reported smart sensor significantly simplifies the ring resonator–based sensing platform for multicomponent chemical analysis and shows a high quantification accuracy. Although this work just presents a simple model system for proof of concept, it promises great potential for multicomponent analysis of complex samples in micro- and nanodevices.
Sign up for Photonics Research TOC. Get the latest issue of Photonics Research delivered right to you!Sign up now
2. METHODS AND MATERIALS
A. Sensing System and Data Analysis
The ring resonator–based smart sensor [Fig. 1(a)] consisted of a silicon ring resonator chip (details are shown in Appendix A) that was integrated with a microfluidic network, a 1550 nm light source, a polarization controller, an optical spectrum analyzer (OSA), and a data acquisition (DAQ) circuit, all packaged into a portable system. The light source was tuned to TE polarization via a fiber polarization controller and coupled into the bus waveguide through a lensed fiber. After propagating through the chip, the light that exited from the through port of the sensing ring was coupled out of the bus waveguide via the other lensed fiber to the OSA for spectrum acquisition. The gap between the bus waveguide and the ring ought to be kept in the range of hundreds of nanometers, so that the light propagating along the waveguide could be coupled into the adjacent ring resonator to form a whispering-gallery mode for resonance detection under critical conditions. A piece of oxygen plasma-treated polydimethylsiloxane (PDMS) film was bonded to the ring resonator chip to form a microfluidic channel, the depth of which was 1 μm and the width was 100 μm [33–36]. The resonator chip was first rinsed with isopropyl alcohol (IPA), ethanol, and deionized (DI) water, followed by oxygen plasma cleaning (PDC-002, Harrick Plasma) for 5 min to remove possible surface contamination. The chip was passivated to prevent molecule adsorption by being immersed in undiluted Sigmacote (SL2, Sigma) solution for 5 min with shaking immediately after oxygen plasma cleaning. After the incubation, the chip was dried at room temperature in a sterilized hood for one hour and washed with sterilized double-distilled water to remove hydrochloric acid (HCl) by-product. The chip was dried at 90°C in an oven for 30 min before use.
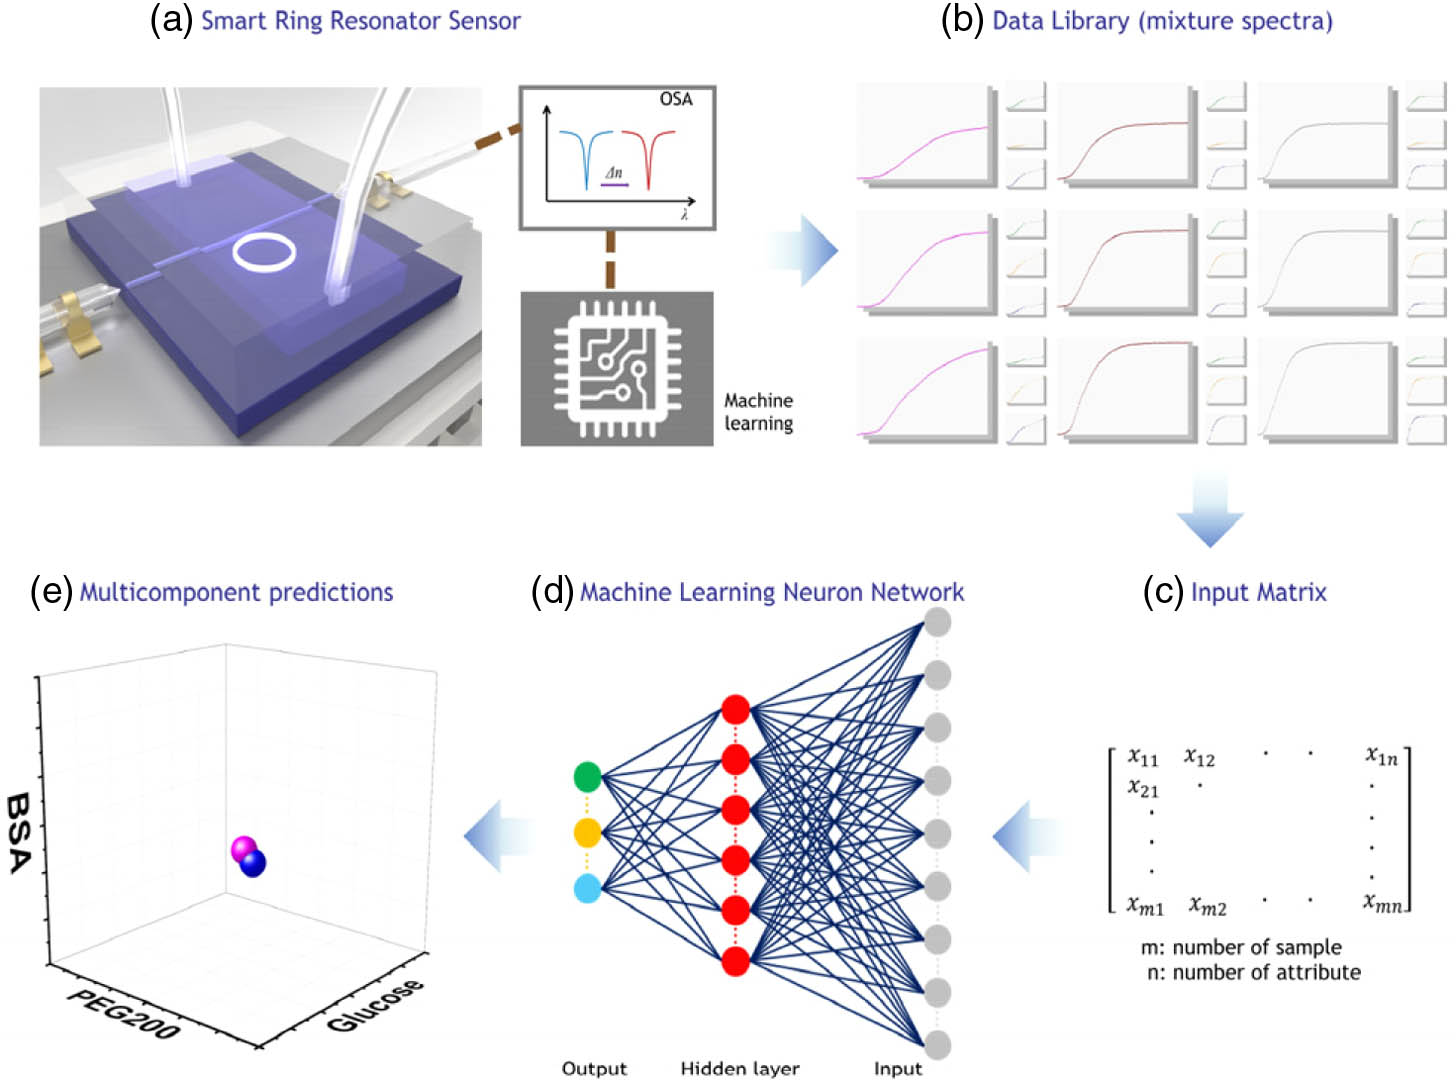
Figure 1.Schematic illustration of smart sensor framework. (a) Acquisition of resonant spectrum using ring resonator–based smart sensor. (b) Resonant spectra are collected into a data library. (c) Transformation of resonant spectra to matrices. (d) Neural network training with transformed resonant spectra. (e) Composition prediction with neural network model.
The data library contained resonant spectra of mixtures comprising PEG200, glucose, and BSA mixed at various concentrations [Fig. 1(b)]. To measure the resonant spectra, the running buffer (Ancillary Reagent Kit 2, DuoSet) was first injected into the microfluidic channel at 30 μL/min for 2 min. The sample was then injected, and the resonant wavelength of the ring resonator was monitored over time to obtain the resonant spectrum. A total of 343 mixtures were measured with the concentration of each component varying from 0 to 30 mg/mL with an increment of 5 mg/mL, while each composition was measured at 5 different flow rates ranging from 10 to 90 μL/min with an increment of 20 μL/min. The microfluidic channel was washed with ample running buffer between measurements.
B. Training of Neural Network for Composition Detection
The data library was divided into training and testing datasets, and each dataset was divided into five subgroups based on the flow rate. Each spectrum in the datasets was labeled with 36 attributes that encoded the concentrations of the three components—PEG200, glucose, and BSA—in the mixture, with 12 attributes for each. The 12 attributes for each component at a particular concentration were extracted from the resonant spectrum of the component in its pure form. The resonant spectra of the mixtures were transformed into matrices [Fig. 1(c)] as the input of the neural network [Fig. 1(d)]. The neural network was trained to decompose the resonant spectrum of the mixture into resonant spectra of individual components and predict the respective concentration of each component [Fig. 1(e)].
A three-layer perceptron neural network (one input layer, one output layer, and a single hidden layer) was adopted to implement a regressor to predict the concentration of each component in a mixture [Fig. 2(a)]. The input layer had 160 neurons, the hidden layer had 64 neurons, and the output layer had 36 neurons. The collected datasets included 343 samples, of which 229 samples were used for training, and the remaining 114 samples were used for the blind testing of the neural network model. Each sample was measured at five different flow rates, and therefore the total number of training samples was . The training and testing datasets were randomly selected from the spectrum library without overlap, which guaranteed that the trained model did not get any information about the testing dataset. The input datasets had a dimension of 160 attributes, and the output had a dimension of 36 attributes, with 12 attributes for each component. The hidden layer had 64 neurons, and thus the matrix sizes for the input layer, hidden layer, and output layer were , , and , respectively. The three layers were fully connected and activated by a rectified linear units (ReLU) function. The training model was set up using TensorFlow [37] and trained over a GPU server with one Nvidia GeForce RTX 2080 card and one Intel Xeon CPU E5-2650. The cost function was defined by the mean square error (MSE), and the optimizer was set to the RMSPropOptimizer with a learning rate of 0.0005 and a decay rate of 0.9. The learning rate and decay rate were selected by trial and error. The cost function was plotted against the number of iterations [Fig. 2(b)]. It quickly descended to a value close to zero after iterations, which indicated the low error of the model on the training set, and no overfitting was observed up to 5000 iterations. Our successful blind test on the testing samples was unknown to the trained model. All evidence proved that the number of training samples was sufficient. Different from other machine learning applications on published datasets, we used a high-quality dataset experimentally collected. The samples and their corresponding labels were of high quality and reliable resolution. With this high-quality dataset, a relatively small number of training samples were able to generate satisfactory machine learning models for accurate prediction. The RMSE is a frequently used way to measure the error of a model in predicting quantitative data. The deviation between prediction and ground truth was evaluated over by the RMSE, which was expressed as where was the predicted value of the th sample, and was the corresponding true value.
Figure 2.Neural network of the smart sensor. (a) The resonant spectrum of an unknown sample mixture is acquired with the ring resonator and fed into the trained neural network. The number of neurons in the input, hidden, and output layers is 160, 64, 36, respectively. The 36 attributes of the output are divided into three groups, each with 12 attributes. Each group of 12 attributes is used to predict the concentration of one component in the mixture. The composition of the unknown sample is determined by the predicted concentrations of all three components. (b) Cost function versus training interactions for samples at 10 μL/min as an example.
The light is coupled into the ring resonator through fiber alignment [38,39]. The light at resonant wavelength is strictly confined in the ring resonator, which results in periodic resonant peaks in a spectrum measured at the through port of the bus waveguide. The cross section of the waveguide in our device is 450 nm by 220 nm, which could confine single-mode light very well. On the other hand, the evanescent field is able to leak from the waveguide to interact with matter that alters the effective refractive index surrounding the ring resonator. This effect is reflected as a shift in the resonant wavelength in the measured spectrum. The ring resonator is an exceptional optical sensor because of its higher value, high sensitivity, ease of fabrication, multiplexity capability, and label-free detection [40]. During operation, the ring resonator is immersed in the running buffer that flows stably in the microfluidic channel, and a stable resonant peak is observed. As the sample flows over the surface of the ring resonator, the resonant peak would shift as a result of the difference in refractive index between the sample solution and the running buffer. This principle is used to analyze chemicals dissolved in the solution. The proposed smart sensor combines the advantage of the highly sensitive ring resonator and neural network to empower intelligent label-free multicomponent chemical analysis. The representative resonant spectra of individual components under a constant flow rate of 30 μL/min are shown in Figs. 3(a)–3(c). The concentrations of PEG200 [Fig. 3(a)], glucose [Fig. 3(b)], and BSA [Fig. 3(c)] increase from 0 to 30 mg/mL with an increment of 5 mg/mL. In all cases, the shift of the resonant peak increases with time and eventually reaches a plateau. The constant value at the plateau is dependent on the concentration of the chemical—the higher the concentration, the larger the resonant wavelength shifts. The representative resonant spectra of individual components at a constant concentration of 20 mg/mL are shown in Figs. 3(d)–3(f). The spectra of each sample are obtained at five different flow rates ranging from 10 to 90 μL/min with an increment of 20 μL/min. As seen in the figures, all measurements for each chemical component reach almost the same plateau regardless of the flow rate, which corroborates that the degree of resonant shift is determined by the chemical concentration. In both the constant-concentration and constant-flow-rate scenarios, samples under different conditions show distinct behaviors in the response region (between zero and the maximum shift). It is speculated that the response region results from the diffusion of target molecules at the interface between the sample solution and running buffer. The microfluidic channel is filled with running buffer before the sample injection. Due to laminar flow at the microscale, the sample solution and the running buffer do not mix at the interface. As the sample solution flows towards the ring resonator, target molecules in the sample solution diffuse into the running buffer and generate a chemical gradient across the interface. The front portion of the chemical gradient, which has a low concentration of target molecules, reaches the ring resonator first, causing a slight shift in resonant wavelength. As the interface flows over the ring resonator, the effective concentration detected by the ring resonator increases with the concentration gradient until it reaches the bulk concentration evidenced by the plateau. The higher the target concentration, the faster the resonant wavelength shifts due to steeper concentration gradient as evidenced by the larger slope in the response regions [Figs. 3(a)–3(c)]. The response region of the resonant spectrum hence contains rich information related to the concentration, diffusion coefficient, and other physical and chemical properties of the target molecules. Similarly, the flow rate also has a strong effect on the response region of the resonant spectrum through the concentration gradient. As the flow rate increases, it takes a shorter time for the interface to reach the ring resonator and hence less time for the molecules to diffuse, causing a steeper concentration gradient at the interface. As a result, the resonant spectrum shows a rapid takeoff and a larger slope in the response region [Figs. 3(d)–3(f)].
Figure 3.Resonant spectra measured by the ring resonator under various conditions. (a)–(c) Resonator spectra for PEG200, glucose, and BSA solution under a constant flow rate of 30 μL/min. The concentration ranges from 0 to 30 mg/mL with an increment of 5 mg/mL. (d)–(f) Resonator spectra for PEG200, glucose, and BSA solution under a constant concentration of 20 mg/mL. The flow rate ranges from 10 to 90 μL/min with an increment of 20 μL/min. (g) For the resonant spectrum of the mixture with 15 mg/mL PEG200, 5 mg/mL glucose, and 15 mg/mL BSA at 50 μL/min flow rate; (h) for the resonant spectrum of the mixture with 25 mg/mL PEG200, 5 mg/mL glucose, and 5 mg/mL BSA at 50 μL/min flow rate; and (i) for the resonant spectrum of the mixture with 20 mg/mL PEG200, 10 mg/mL glucose, and 5 mg/mL BSA at 50 μL/min flow rate.
The representative resonant spectra of sample mixtures are shown in Figs. 3(g)–3(i). Unfortunately, the resonant spectra of the mixtures do not show prominent features unique to each specific component. Because the key feature regions (i.e., the response regions) of the three components substantially overlap with each other, it is difficult to perform multicomponent chemical analysis by using handcrafted features. Fortunately, we are able to train a neural network for multicomponent chemical analysis using the resonant spectrum of the mixture acquired with the ring resonator. The training of the neural network is described in detail in Section 2.B. The neural network is able to predict the concentration of each individual component based on the resonant spectrum of the mixture. The accuracy of the neural network model is evaluated with the testing dataset by comparing the predicted composition of the mixture (i.e., the concentrations of all three components) with the ground truth. The prediction error is defined by the RMSE between the predicted values and the ground truth. Each sample composition is measured at five different flow rates, and the predicted compositions at these flow rates are averaged to improve the accuracy of prediction. The neural network model has a low prediction error on the entire testing dataset, ranging only from 0.13 to 2.28 mg/mL over the tested range of 0–30 mg/mL. Figure 4(a) presents an intuitive visualization of the relationship between the predicted composition (magenta dots) and the ground truth (blue dots) of 10 representative mixtures. As seen in the figure, each predicted composition is located close to the respective ground truth, suggesting a high prediction accuracy. The predicted compositions of three mixtures are listed in Table 1. In this case, RMSE is reflected by the distance between the prediction point and ground truth point in Fig. 4(a), which is a measure of difference between the prediction and the ground truth. While the neural network model gives reasonably accurate prediction of the composition at each flow rate, the prediction error may vary over a relatively wide range from one flow rate to another (Tables 1–3). It is noticed that the average prediction values lead to small prediction errors. Hence, the average prediction values are used to determine the composition of the mixture. The distribution of the prediction array of all samples in the testing dataset is shown in Fig. 4(b). All prediction errors are below 2.5 mg/mL over the tested range of 0–30 mg/mL, with more than 75% of the predictions having an error no greater than 1 mg/mL. The median is 0.63 mg/mL, and the average is 0.76 mg/mL with standard deviation of 0.47 mg/mL. The predicted concentrations of the three components (PEG200, glucose, and BSA) for all the samples in the testing dataset are plotted against the ground truth (i.e., the expected concentrations) as shown in Fig. 5. The predicted concentrations show a good linear correlation with the ground truth, with almost all the data points falling within the 95% prediction bands, again suggesting accurate prediction of our neural network model.
Figure 4.Composition predicted by the neural network model. (a) 3D distribution of the prediction composition and the ground truth (10 representative points). (b) Histogram of prediction error (RMSE) for all 114 samples in the testing dataset.
Conventional ring resonator–based sensors only use a single parameter, which is the maximal shift of the resonant wavelength at the steady state (i.e., the plateau in the resonant spectrum), to detect the target. Such a single parameter carries very limited information of the target molecules. By monitoring the resonant wavelength shift over time and plotting the entire resonant spectrum, our sensor is able to acquire more information on the physical and chemical properties of the target molecules. Nevertheless, these pieces of information are buried in the response region of the resonant spectrum because the response regions of individual components substantially overlap with each other. As a result, it is a great challenge to predict the composition of a mixture by decomposing its resonant spectrum using conventional algorithms that are based on handcrafted features. Fortunately, the buried features can be uncovered by machine learning. The machine learning model is able to predict the composition of a mixture with a high accuracy. By combining the highly sensitive ring resonator–based sensor and the intelligent neural network model, we demonstrate a highly accurate smart sensor for label-free multicomponent chemical analysis.
4. CONCLUSIONS
In summary, we demonstrate a machine learning assisted smart sensor for label-free multicomponent chemical analysis. The smart sensor uses the resonant spectrum of a mixture measured by the high-sensitivity and label-free ring resonator to perform multicomponent chemical analysis. The prediction of the mixed compounds is realized by utilizing a neural network model. It shows a high prediction accuracy with a low RMSE ranging only from 0.13 to 2.28 mg/mL. The predicted concentrations of all compounds fall within the 95% prediction bands. With its simple label-free detection strategy and high accuracy, the smart sensor unveils great potential applications for the analysis of various chemical compounds. It also opens up a new avenue for the development of data-driven smart sensors.
APPENDIX A: FABRICATION PROCESS OF MICRORING RESONATOR
The sensing structure, a microring resonator, is fabricated on a silicon-on-insulator (SOI) wafer with a 220-nm Si top layer. First, the 70-nm thick silicon is etched by inductively coupled plasma reactive ion etching (RIE) to form grating couplers, and the remaining 150-nm Si is etched to define the wire waveguides. Subsequently, an upper cladding layer of 1.5-μm silica is deposited by plasma-enhanced chemical vapor deposition (PECVD). After that, the sensing window of the microring resonator is opened by anisotropic RIE dry etching and isotropic etching based on vapor hydrogen fluoride (HF) to remove the silica upper cladding. The scanning electron micrograph (SEM) of the fabricated microring resonator is shown in Fig.?6.
Figure 6.SEM of the fabricated microring resonator.
[9] A. H. Kamal, S. F. El-Malla, S. F. Hammad. A review on UV spectrophotometric methods for simultaneous multicomponent analysis. Eur. J. Pharm. Med. Res., 3, 348-360(2016).
[37] M. Abadi, P. Barham, J. Chen, Z. Chen, A. Davis, J. Dean, M. Devin, S. Ghemawat, G. Irving, M. Isard. TensorFlow: a system for large-scale machine learning. 12th USENIX Symposium on Operating Systems Design and Implementation, 265-283(2016).
[38] H. Zhang, M. F. Karim, S. Zheng, H. Cai, Y. Gu, S. S. Chen, H. Yu, A. Q. Liu. A high-resolution dual-microring-based silicon photonic sensor using electronic integrated circuit. CLEO: Applications and Technology, ATh4O.4(2018).
[39] H. Zhang, M. F. Karim, S. Zheng, H. Cai, Y. Gu, S. S. Chen, H. Yu, A. Q. Liu. Machine learning and silicon photonic sensor for complex chemical components determination. CLEO: Science and Innovations, JW2A.54(2018).