
Zhen-Zhe Lei, Yan-Jun Gu, Zhan Jin, Shingo Sato, Alexei Zhidkov, Alexandre Rondepierre, Kai Huang, Nobuhiko Nakanii, Izuru Daito, Masakai Kando, Tomonao Hosokai. Supersonic gas jet stabilization in laser–plasma acceleration[J]. High Power Laser Science and Engineering, 2023, 11(6): 06000e91
- High Power Laser Science and Engineering
- Vol. 11, Issue 6, 06000e91 (2023)
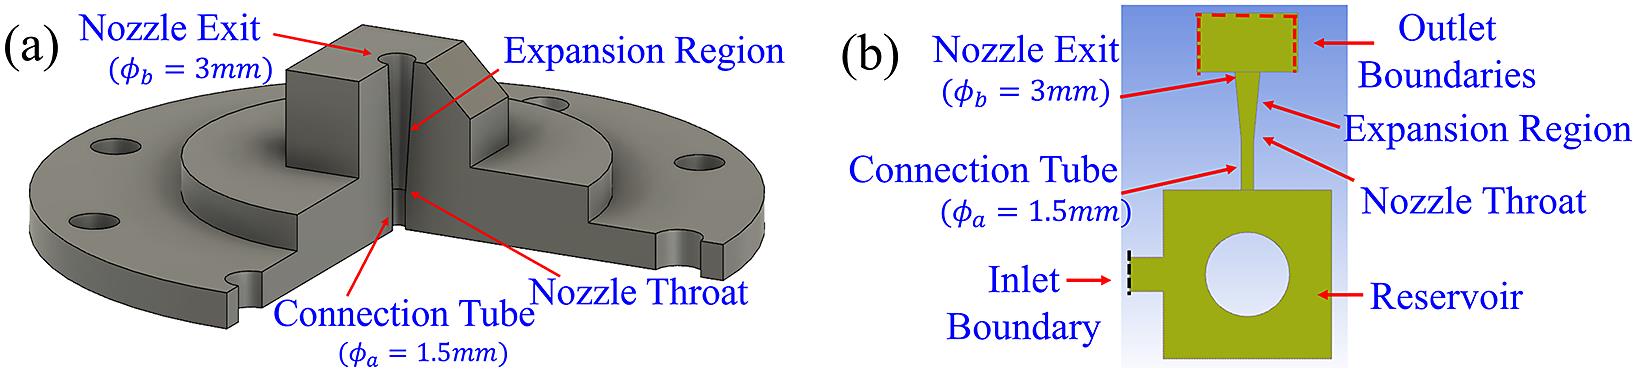
Fig. 1. (a) Sketch of the simple-conical nozzle. (b) Schematic of the fluid dynamics simulation domains for the simple-conical nozzle.
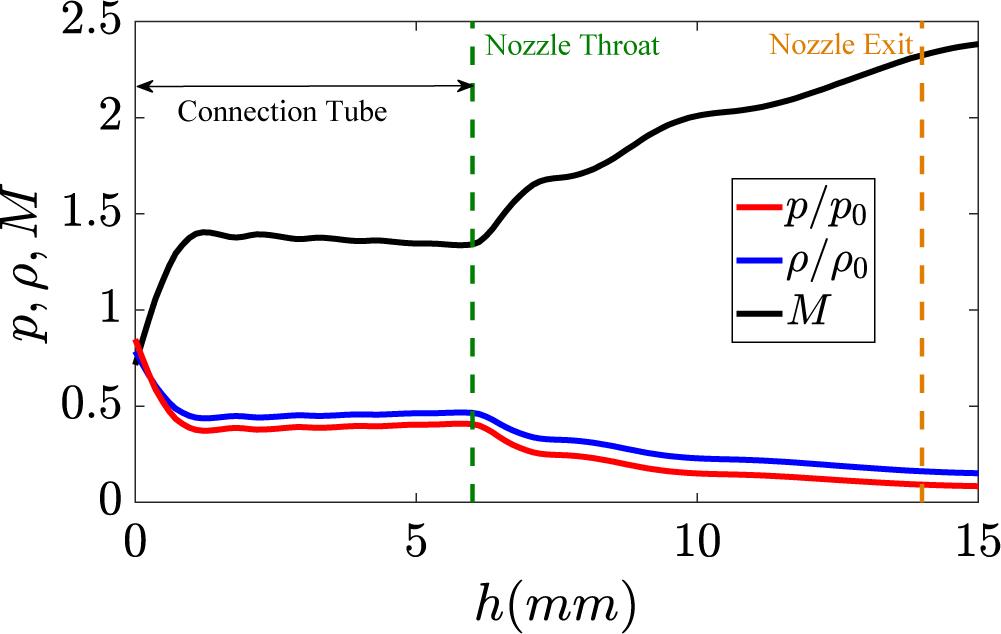
Fig. 2. (a) Profiles of gas density, pressure and Mach number along the vertical direction from the connection tube to the exit. The density and pressure are normalized to the initial condition.
Fig. 3. (a) Velocity distribution (normalized to the sound speed) and streamlines in the gas reservoir part. (b) Distribution of the turbulent kinetic energy in the gas reservoir part with a logarithmic scale. (c), (d) Velocity distributions and streamlines for the cases of left and down shift in the reservoir, respectively.
Fig. 4. (a) Gas density and (b) pressure profiles at the nozzle throat obtained in the different initial shift cases (black-none, red-up, blue-down, green-left, orange-right), respectively. The triangle marker directions refer to the shift directions of the central obstacle.
Fig. 5. (a) Sketch of the converging–diverging nozzle. (b) Schematic of the fluid dynamics simulation domains for the converging–diverging nozzle. (c) Velocity distributions (normalized to the sound speed) and streamlines inside the stilling chamber part. The subplots from left to right correspond to the non-, up-, down-, left- and right-shift cases, respectively. (d) The density profiles in the converging region, diverging region and 1 mm above the exit are compared between the up-shift and down-shift cases.
Fig. 6. Experimental schematic diagram of the Mach–Zehnder interferometer setup.
Fig. 7. Electron beam pointing distributions obtained in experiments with (a) the simple-conical nozzle and (b) the converging–diverging nozzle.
|
Table 1. S-C nozzle and C-D nozzle represent the simple-conical nozzle and the converging–diverging nozzle, respectively. (Values not in bold are taken from the fluid dynamics simulations, while those in bold are obtained from the experimental measurements. Std. represents the standard deviation from 20 shots in the experiment and five cases in simulations. Max. represents the maximum discrepancy in the 20 shots in the experiment and five cases in simulations.)

Set citation alerts for the article
Please enter your email address
© Copyright 2018-2021 | Chinese Laser Press. All Rights Reserved 沪ICP备15018463号-20