• Journal of Geographical Sciences
  • Vol. 30, Issue 10, 1681 (2020)
Michael DUNFORD1、2, Zhigao LIU1、2、3、*, and Jiashun XUE1、4
Author Affiliations
  • 1Institute of Geographic Sciences and Natural Resources Research, CAS, Beijing 100101, China
  • 2Key Laboratory of Regional Sustainable Development Modeling, CAS, Beijing 100101, China
  • 3College of Resources and Environment, University of Chinese Academy of Sciences, Beijing 100049, China
  • 4University of Chinese Academy of Sciences, Beijing 100049, China
  • show less
    DOI: 10.1007/s11442-020-1807-7 Cite this Article
    Michael DUNFORD, Zhigao LIU, Jiashun XUE. Chinese overseas ports: Market potential, supply capacity and access to imports[J]. Journal of Geographical Sciences, 2020, 30(10): 1681 Copy Citation Text show less
    Cumulative causation: conditions of production and exchange, specialization, trade and investment(Source: elaborated from Dunford et al., 2014)
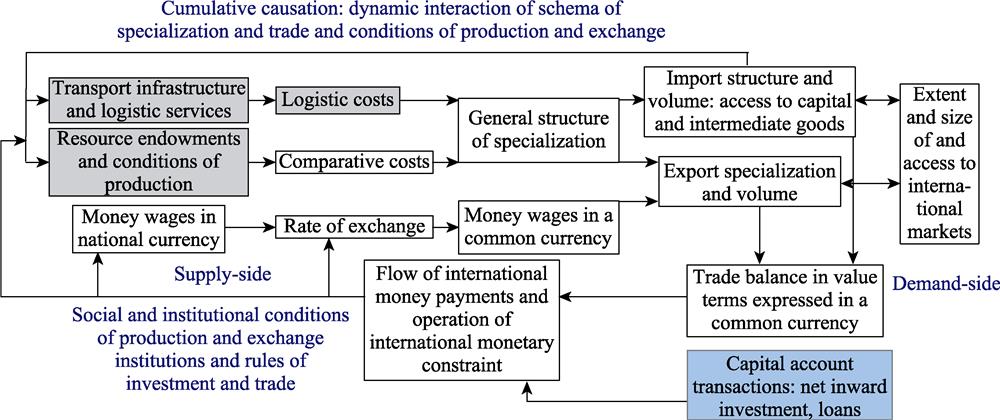
    Fig. 1. Cumulative causation: conditions of production and exchange, specialization, trade and investment(Source: elaborated from Dunford et al., 2014)
    Overseas ports constructed or owned and operated by Chinese companies, 2017(Source: compiled by the authors from news and company reports)
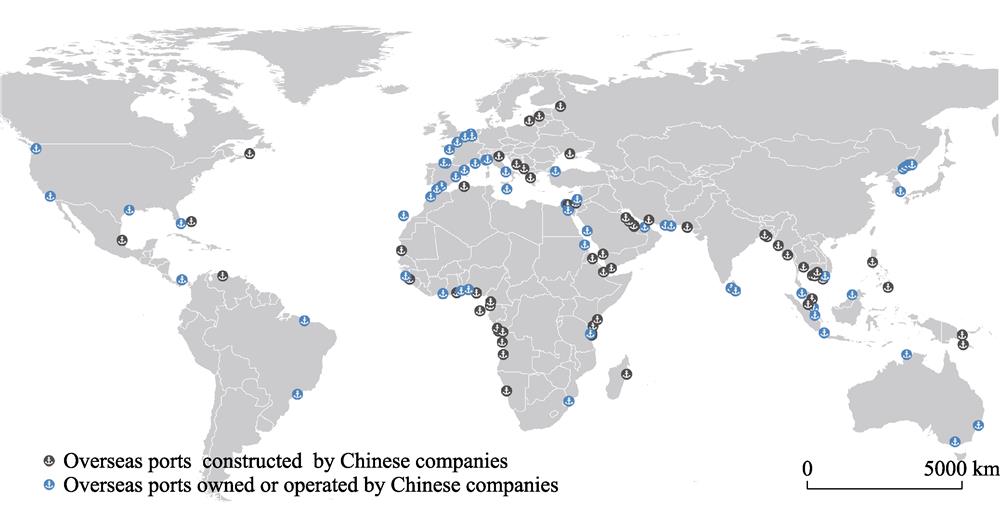
    Fig. 2. Overseas ports constructed or owned and operated by Chinese companies, 2017(Source: compiled by the authors from news and company reports)
    Evolution and geography of Chinese overseas ports(Source: Chinese ports database. Note: CIS=Commonwealth of Independent States; EA=East Asia; EUR=Europe; LAC=Latin America and the Caribbean; MENA=Middle East and North Africa; NA=North America; OCE=Oceania; SA=South Asia; SEA=Southeast Asia; SSA=Sub-Saharan Africa)
    Fig. 3. Evolution and geography of Chinese overseas ports(Source: Chinese ports database. Note: CIS=Commonwealth of Independent States; EA=East Asia; EUR=Europe; LAC=Latin America and the Caribbean; MENA=Middle East and North Africa; NA=North America; OCE=Oceania; SA=South Asia; SEA=Southeast Asia; SSA=Sub-Saharan Africa)
    Evolution of world exports in countries with and without Chinese overseas ports and of nominal global commodity prices, 2007-2017(Source: trade data elaborated from World Bank, WITS, https://wits.worldbank.org/ and World Bank, commodity prices from http://www.worldbank.org/en/research/commodity-markets)
    Fig. 4. Evolution of world exports in countries with and without Chinese overseas ports and of nominal global commodity prices, 2007-2017(Source: trade data elaborated from World Bank, WITS, https://wits.worldbank.org/ and World Bank, commodity prices from http://www.worldbank.org/en/research/commodity-markets)
    Foreign market potential and supply capacity of Chinese overseas ports, 2008 to 2017
    Fig. 5. Foreign market potential and supply capacity of Chinese overseas ports, 2008 to 2017
    Foreign market potential and supply capacity of Chinese overseas ports, 2012 to 2017
    Fig. 6. Foreign market potential and supply capacity of Chinese overseas ports, 2012 to 2017
    Import supply and demand potential, 2008-2017
    Fig. 7. Import supply and demand potential, 2008-2017
    Import supply and demand potential, 2012-2017
    Fig. 8. Import supply and demand potential, 2012-2017
    Market potential, supply capacity and per capita GDP, 2017
    Fig. 9. Market potential, supply capacity and per capita GDP, 2017
    2000200820122017
    GDP share (%)Construction contract15.015.515.514.9
    Investment42.540.338.937.7
    Neither42.544.245.647.4
    Population share (%)Construction contract23.424.124.625.2
    Investment15.915.715.615.4
    Neither60.760.159.859.4
    GDP per capita (2010 USD)Construction contract5202609961536264
    Investment21690243192448225974
    Neither5694696674818472
    Export share (%)Construction contract19.718.217.517.3
    Investment34.334.535.835.8
    Neither45.947.346.746.9
    Import share (%)Construction contract14.316.716.414.8
    Investment40.538.437.839.0
    Neither45.144.945.846.3
    2008201220142017
    AgricultureConstruction contract11.016.514.917.1
    Investment43.438.338.837.7
    Neither45.645.246.345.2
    FuelsConstruction contract46.849.446.738.6
    Investment23.022.422.826.5
    Neither30.228.230.635.0
    ManufacturesConstruction contract9.410.510.510.7
    Investment33.129.929.928.5
    Neither57.559.659.660.8
    Ores and metalsConstruction contract19.825.125.525.8
    Investment26.423.823.922.8
    Neither53.751.150.551.4
    Total exportsConstruction contract15.818.317.414.7
    Investment32.630.030.129.4
    Neither51.651.752.555.9
    Table 1.

    Gross domestic product, population and trade evolutions of countries with and without Chinese overseas ports (Source: elaborated from Chinese ports database, WITS and World Bank)

    Data usedDependent variableYearCoefficients of distanceAdjusted R-squaredReporter dummies (of 61 number not significant)Partner dummies (of 205 number not significant)
    Full trade matrixln(exports)2008-1.6537***0.8813150
    2012-2.1889***0.894810
    2017-1.5850***0.9025180
    ln(imports)2008-1.5257***0.8769170
    2012-1.9156***0.905060
    2017-1.3294***0.9030141
    Revised trade matrixln(exports)2008-2.0107***0.9691120
    2017-1.4228***0.9706140
    ln(imports)2008-1.5447***0.981160
    2017-1.5160***0.980600
    Table 2.

    Estimating trade models for countries with Chinese overseas ports, 2008-2017

    Export modelImport model
    ln (2017 Foreign market demand potential)0.486***
    ln (2017 Foreign market supply capacity)0.059***
    ln (2017 Foreign partner supply capacity)0.213
    ln (2017 Foreign import access)0.300***
    Constant4.542***5.480**
    F13.330***42.110***
    R-squared0.2040.447
    Table 3.

    GDP per capita, market potential, supply capacity and foreign import access, 2017

    Michael DUNFORD, Zhigao LIU, Jiashun XUE. Chinese overseas ports: Market potential, supply capacity and access to imports[J]. Journal of Geographical Sciences, 2020, 30(10): 1681
    Download Citation