
Michael DUNFORD, Zhigao LIU, Jiashun XUE. Chinese overseas ports: Market potential, supply capacity and access to imports[J]. Journal of Geographical Sciences, 2020, 30(10): 1681
- Journal of Geographical Sciences
- Vol. 30, Issue 10, 1681 (2020)
Abstract
Keywords
1 Introduction
A number of Chinese companies have recently played major roles in the development of overseas ports. With the implementation of China’s Belt and Road Initiative (BRI), many of these ports are playing significant roles in the construction of a Maritime Silk Road and its articulation with overland infrastructure investment (
To this end, the next section briefly examines the role of port infrastructure and logistic services in economic development. The second section outlines the evolution of economic potential models, sets out the modelling framework and identifies the sources of the data used in this research. The third outlines the development of Chinese overseas ports, while the fourth and fifth present the empirical results of the trade and economic potential modelling. The sixth section concludes.
2 Port infrastructures, sea transport and economic development
The development of an international division of labour involves not just the development of clusters of internationally inter-related value added chains but also the development of local and global logistic services in which port and other transport infrastructures play a fundamental role, acting as vital nodal and channel spaces (
At one level, ports act as interfaces between national economies and adjacent territories and the international economy, handling and embedding commodity and related information flows (
Although the size of markets and the associated geographies of export and import supply and demand shape trade (
In the context of ever changing economic and logistic systems, each port competes for a share of the traffic generated in its own hinterland and a wider market area. This wider market area is made up of the ports and port hinterlands throughout the world with which it is connected. The outcome depends in part on the relative capacity or quality of five things: (1) ports and their infrastructures; (2) the road, rail and water communications infrastructures linking them with their hinterlands; (3) their maritime interface; (4) their conditions of maritime access; and (5) their cargo handling capabilities. These conditions involve massive investments undertaken ahead of demand. In the case of established ports, they may entail redevelopment and relocation. Cost recovery can take many decades. These investments clearly increase potential connectivity and competitiveness. Yet they remain a gamble, as the attraction of shipping also depends on the decisions of international and regional shipping lines that reflect alliances and carrier involvement in the equity of container terminals. After acquiring the port of Piraeus in Greece, COSCO’s CEO, Wei Jiafu, said “We have a saying in China, ‘Construct the eagle’s nest, and the eagle will come’.’’ We have constructed such a nest in your country to attract such Chinese eagles’ (
At the same time ports and the commercial shipping they seek to attract play an important role in driving down the time and costs of circulation and exchange, reducing transport and related logistic costs, speeding up the turnover of capital and reducing inventories (
As well as helping drive trade and goods traffic, ports and related economic development zones act as growth centres: they create externalities and close input-output relationships, support the growth of value-added and play a role in innovation. In these ways, ports have non-negligeable effects on Gross Domestic Product (GDP) in the regions where ports are located and more widely when planned regional investment in mainland transport systems creates well-connected logistic hubs. Additionally, the quest for maritime security adds a naval dimension to the development of ports and ocean transport, which itself generates incomes and rents.
![]()
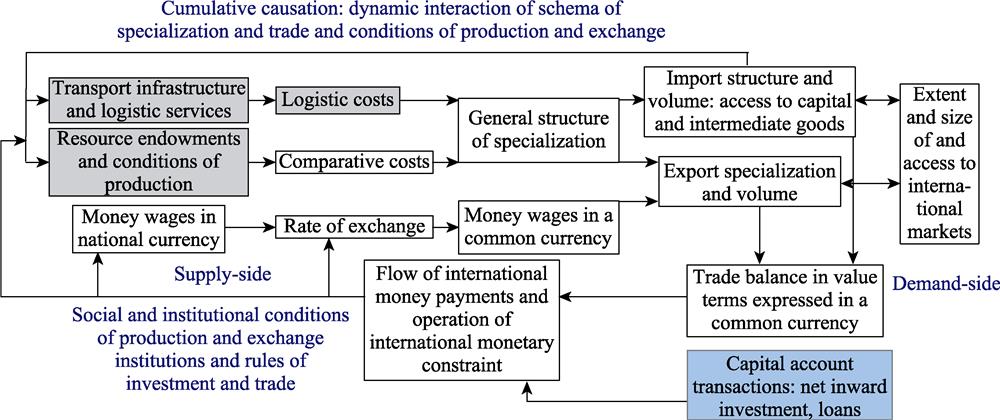
Figure 1.
These causal mechanisms underpin the belief that investment in port infrastructures and enhanced connectivity can drive international trade and GDP growth and contribute to processes of circular and cumulative causation (
Changes in national and international conditions can of course affect this dynamic interaction of this schema of specialization and trade, capital movements and the conditions of production and exchange. Accordingly, the aim of this study is to ask whether there is evidence of positive impacts on trade and whether there is a clear relation between trade and GDP in countries with recent Chinese overseas port infrastructure investments, acknowledging that these investments are only one of a multiplicity of factors.
3 Trade, market potential and supply capacity: gravity principle perspectives
To examine the relation between port investment, trade and economic development, this research drew on gravity and market potential principles. The concept of market potential dates from an article by
These concepts derive from gravity principles whose application to the social sciences was first associated with Carey (1858-9). Gravity principles were subsequently incorporated in Ravenstein’s laws of migration (
In the early 1960s gravity and economic potential ideas were taken up by economists interested in international trade (
In 1999 Hummels (cited in
In a more recent study,
Harris defined the market potential of a city as the sum of retail sales of each county divided by the transport cost of reaching it from the city in question. In this research, an approach close to that of
The method adopted involved the estimation of trade equations. The aim was to identify (1) the impact on trade of bilateral distance costs between countries with Chinese overseas ports and all countries in the world and (2) the supply and market capacities of the countries in which these ports are located, defined respectively as
where
where
and supply capacity
with, in this case, $d_{ij}^{\theta }$ denoting the distance between the port and the capital cities of all partner countries.
This model essentially represents the proximity or access of a port to export markets and its capacity to supply exports. Market access is an indicator of market potential, measuring export demand given a port’s location relative to its trading partners. Supplier capacity is a measure of the capacity of the port to export to the rest of the world. On the import side a similar distance weighted measure of imports is an indicator of access to imports (ability to import capital and intermediate goods for example) of the port and the hinterland it serves.
To estimate bilateral exports the following econometric specification was adopted:
where
To check the results, a second simpler trade model was also estimated. This model used national GDP for countries with ports and their trade partners as follows
where (
In this research market potential was also estimated using indicators of the impact of the domestic markets of port countries on trade. In this case,
To estimate these relationships and to investigate a number of other characteristics of Chinese ports and the countries in which they are located, several data sets were assembled. The first provided information about Chinese overseas ports and was collected from a comprehensive search of public official sources in China and the host countries, international research institutes, Chinese policy and commercial banks and Chinese contractors and was verified by media and other additional sources. A second set of data covered the exports (Free on Board) and imports (Cost Insurance Freight) by a number of broad sectors (total, agricultural products, fuels, ores and metals, manufactures and other) for all countries in the world for which there were COMTRADE data available from the World Bank’s World Integrated Trade Solution (WITS) and for most of the individual years from 2007 to 2017. The third set of data related to the real and current GDP and the population of all countries in the world, covering the period from 2000 to 2017. Alongside these data, information on the evolution of commodity prices was derived from World Bank sources.
4 The evolution of Chinese overseas ports
The development of ports and related economic development zones played a central role in the rise of China as the world’s second largest economy and as its manufacturing workshop. China has constructed more than 184 new ports since the 1970s. Starting in 2000, Chinese companies were increasingly involved in the construction and acquisition of interests in overseas ports and port, industrial and related residential zones, with parallel initiatives to establish shipping routes and expand the maritime traffic of these ports.
In April 2019 the Chinese government released a progress report (
![]()
Figure 2.
Most of these port investment companies are centrally-owned state-owned companies (SOEs) (see
In some cases, Chinese investment involves the construction of overseas ports under Engineering, Procurement and Construction (EPC), Build, Operate and Transfer (BOT) or Build, Buy, Operate and Transfer (BBOT) contracts. In this case the principal actor is CCCC. To date CCCC has been involved in 36 projects. Chinese companies also engage in mergers, acquisitions and joint ventures to acquire an interest in and operate overseas ports. This type of activity principally involves COSCO Shipping, which owns China’s largest shipping fleet and at present manages and operates 21 overseas ports, including container terminals in Piraeus and Zeebrugge where it enjoys 100% control, and CMG which has interests in 20 overseas ports. In a number of cases these projects involve not just the creation of new port facilities but also the establishment of economic development zones.
![]()
Figure 3.
From 2000 until 2003 Chinese companies started just one new overseas port initiative per year (
Investment projects were most numerous in Europe (18), as Figures 2 and 3 show. The overall number of projects was large in Sub-Saharan Africa (27, of which 21 involved construction projects), the Middle East and North Africa (18, of which 11 were construction projects), Southeast Asia (14) and South Asia (10, of which 7 were construction projects).
Clearly, investments were predominantly in ports in developed countries (with an average GDP per capita of USD 24,319 in 2008 and large domestic markets). Construction projects were mainly in developing countries and in particular in low income countries with an average GDP per capita of USD 6,099 (
| 2000 | 2008 | 2012 | 2017 | ||
|---|---|---|---|---|---|
| GDP share (%) | Construction contract | 15.0 | 15.5 | 15.5 | 14.9 |
| Investment | 42.5 | 40.3 | 38.9 | 37.7 | |
| Neither | 42.5 | 44.2 | 45.6 | 47.4 | |
| Population share (%) | Construction contract | 23.4 | 24.1 | 24.6 | 25.2 |
| Investment | 15.9 | 15.7 | 15.6 | 15.4 | |
| Neither | 60.7 | 60.1 | 59.8 | 59.4 | |
| GDP per capita (2010 USD) | Construction contract | 5202 | 6099 | 6153 | 6264 |
| Investment | 21690 | 24319 | 24482 | 25974 | |
| Neither | 5694 | 6966 | 7481 | 8472 | |
| Export share (%) | Construction contract | 19.7 | 18.2 | 17.5 | 17.3 |
| Investment | 34.3 | 34.5 | 35.8 | 35.8 | |
| Neither | 45.9 | 47.3 | 46.7 | 46.9 | |
| Import share (%) | Construction contract | 14.3 | 16.7 | 16.4 | 14.8 |
| Investment | 40.5 | 38.4 | 37.8 | 39.0 | |
| Neither | 45.1 | 44.9 | 45.8 | 46.3 | |
| 2008 | 2012 | 2014 | 2017 | ||
| Agriculture | Construction contract | 11.0 | 16.5 | 14.9 | 17.1 |
| Investment | 43.4 | 38.3 | 38.8 | 37.7 | |
| Neither | 45.6 | 45.2 | 46.3 | 45.2 | |
| Fuels | Construction contract | 46.8 | 49.4 | 46.7 | 38.6 |
| Investment | 23.0 | 22.4 | 22.8 | 26.5 | |
| Neither | 30.2 | 28.2 | 30.6 | 35.0 | |
| Manufactures | Construction contract | 9.4 | 10.5 | 10.5 | 10.7 |
| Investment | 33.1 | 29.9 | 29.9 | 28.5 | |
| Neither | 57.5 | 59.6 | 59.6 | 60.8 | |
| Ores and metals | Construction contract | 19.8 | 25.1 | 25.5 | 25.8 |
| Investment | 26.4 | 23.8 | 23.9 | 22.8 | |
| Neither | 53.7 | 51.1 | 50.5 | 51.4 | |
| Total exports | Construction contract | 15.8 | 18.3 | 17.4 | 14.7 |
| Investment | 32.6 | 30.0 | 30.1 | 29.4 | |
| Neither | 51.6 | 51.7 | 52.5 | 55.9 |
Table 1.
Gross domestic product, population and trade evolutions of countries with and without Chinese overseas ports (Source: elaborated from Chinese ports database, WITS and World Bank)
This study relates to a period starting with the western financial crisis in 2007-2008. As
![]()
Figure 4.
These port investments were given a strong impetus by the recent evolution of China’s economic statecraft and, in particular, by the establishment of China’s Belt and Road Initiative (BRI). Many of these ports play significant roles in the Maritime Silk Road and act as nodes connecting maritime routes with overland infrastructure investment (
As this section has indicated, these investments were made in difficult time for the world economy. However, data in
5 Trade, market potential and supply capacity estimation
As already mentioned the value of bilateral exports (and imports) in the trade equations depends on the supply (market) capacity of the exporter (importer), the market capacity (supply capacity) of the importer (exporter) and bilateral transport costs, represented in this case simply by distance between host capital cities and ports and capital cities of trade partners (see also
In the matrix of bilateral trade flows there were a significant number of missing entries. The existence of missing values could reflect the fact that particular trade flows were in fact zero. Nevertheless, observation of the series for total flows suggests that in some cases values were missing, especially as in a few cases zero values were actually recorded. In these circumstances, and, in the first instance, a value of one was added to all zero trade flows measured in US dollars before taking logarithms (the logarithm of one is zero).
Zero flows do exist however as pairs of countries do not trade with each other, especially if data are disaggregated by commodity. Asymmetric flows are also common, while the number of countries that trade with each other tends to increase over time. To deal with issues arising from these considerations, a number of methods aim to address the selection bias associated with the non-random elimination of zeros from trade matrices. A two-stage approach proposed by
Variation in the density of the matrices does affect the estimated coefficients. As a result, the analyses of export and import evolutions reported in this article involved a number of adjustments. First, in cases where there were positive values for trade in certain sectors and no total trade value, the sectoral components were added up to estimate the total. Second, where there were total values for 2007 and not for 2008 and for 2016 and not for 2017, the 2007 and 2016 values were used. Third, cases where bilateral trade was still recorded as zero before and after these adjustments were dropped from the analysis of evolutions. In each case, the impact of the adjustments was observed. The main consequence was a reduction in the relative scores for recent years, as occurred in the case of estimates of export market potential.
| Data used | Dependent variable | Year | Coefficients of distance | Adjusted | Reporter dummies (of 61 number not significant) | Partner dummies (of 205 number not significant) |
|---|---|---|---|---|---|---|
| Full trade | ln(exports) | 2008 | -1.6537*** | 0.8813 | 15 | 0 |
| 2012 | -2.1889*** | 0.8948 | 1 | 0 | ||
| 2017 | -1.5850*** | 0.9025 | 18 | 0 | ||
| ln(imports) | 2008 | -1.5257*** | 0.8769 | 17 | 0 | |
| 2012 | -1.9156*** | 0.9050 | 6 | 0 | ||
| 2017 | -1.3294*** | 0.9030 | 14 | 1 | ||
| Revised trade matrix | ln(exports) | 2008 | -2.0107*** | 0.9691 | 12 | 0 |
| 2017 | -1.4228*** | 0.9706 | 14 | 0 | ||
| ln(imports) | 2008 | -1.5447*** | 0.9811 | 6 | 0 | |
| 2017 | -1.5160*** | 0.9806 | 0 | 0 |
Table 2.
Estimating trade models for countries with Chinese overseas ports, 2008-2017
This result is what one might expect if the construction of new infrastructures from 2012 had significant impacts on national accessibility to markets for exports and imports, though it will also reflect trends in the value of trade. The null hypothesis that the coefficients of the dummy variables were equal to zero was rejected by an F test (significant at the 0.0001 level), and the models remarkably explained at least 88% of the variation in the dependent variables in the case of the full trade matrix and more than 98% in the case of the matrices with no missing values.
6 Evolution of export market potential, export supply capacity and access to imports of countries with overseas Chinese ports
The next step was to use the coefficients estimated from the model (and the coefficients from the GDP models) to estimate the export market potential of each port, their export supply capacities and their access to imports (using for these estimates the distance from the port to capital cities of partner countries). In this case, of course, what is estimated is the role only of foreign markets. As already mentioned, models including the domestic market (domestic supply to domestic markets and domestic demand for domestic products) were also estimated, but, as the trade model did not provide estimates of domestic distance impedance, a different formulation outlined earlier had to be used.
An attempt was made to map the geography of economic potential and its evolution. The export reporter (countries with ports) scores for different years were highly correlated, as were the partner fixed effects. As one might expect, the export market potential of partners was closely correlated with their import supply potential. The difficulty is that the values vary with the density of the matrix of trade flows. To deal with this problem, the comparisons rest on export market potential, export supply capacities and access to imports computed for matrices with positive trade flows. The results are however similar to those derived from the full trade matrix and from matrices in which sums of sectoral components of trade for 2007 and 2016 values were used as estimates of missing total, 2008 and 2017 bilateral exports and imports.
The export market potential and supply capacity scores are plotted in
![]()
Figure 5.
The 45° line indicates a significant increase in market potential for all of the ports in 2008 to 2017. These increases reflected the overall decline in the distance impedance factor reported in
In the case of supply capacity (right-hand side of
![]()
Figure 6.
The relationship between the scores in 2012 and 2017 differ. Distance impedance declined from -1.93 in 2012 to -1.50 in 2017 but the recorded volume of world exports declined, and in these circumstances market potential scores diminished (left-hand side of
In 2008-2017 there was also a large increase in access to imports (import supply potential), as is indicated on the left-hand side of
![]()
Figure 7.
As indicated earlier, Chinese overseas port investments accelerated after 2012. At the same time it is important to remember that many of the impacts of major infrastructure take years to emerge, and that many factors are at working in driving national trajectories. As in the case of export data,
![]()
Figure 8.
Market potential and supply capacity are important drivers of income (see, for example,
![]()
Figure 9.
| Export model | Import model | |
|---|---|---|
| ln (2017 Foreign market demand potential) | 0.486*** | |
| ln (2017 Foreign market supply capacity) | 0.059*** | |
| ln (2017 Foreign partner supply capacity) | 0.213 | |
| ln (2017 Foreign import access) | 0.300*** | |
| Constant | 4.542*** | 5.480** |
| F | 13.330*** | 42.110*** |
| 0.204 | 0.447 |
Table 3.
GDP per capita, market potential, supply capacity and foreign import access, 2017
As these results show, the development of Chinese overseas port infrastructures has gone hand in hand with increases in export (foreign) market potential since 2012, and, in the case of a significant share of countries with ports, in export supply capacity. These two factors are generally associated with increases in income, although it must be emphasized that these results derive from the interaction of a wide range of factors: the impedance of distance, the evolution of international trade, infrastructural investment that facilitates trade and the redeployment of the economies of ports and their hinterlands. In somewhat inauspicious times for international trade, a reduction in the impedance of distance, increases in export supply capacity and increased availability of imported goods (capital, equipment and consumer goods) are however what one might expect from investment in improved port and related logistic infrastructures, although these investments do of course constitute only a part of the overall investments that drive the evolution of economies, varying in size with the size of the projects and the levels of national economic development.
7 Conclusions
For many countries, exports and access to capital equipment and intermediate goods are important drivers of growth. However, these drivers are strongly affected by geographical location, the impedance of distance and underlying transport and infrastructural conditions that influence transport and logistic costs. Geographical remoteness and high logistic costs affect the cost of a country’s exports in foreign markets, as well as the costs they must pay for supplies of capital and intermediate goods, sourced mainly from the more developed economies of the United States, Western Europe and East Asia and needed to increase export supply capabilities. Ad valorem transport and communications costs paid by countries that are remote or close only to weakly developed countries and that lack infrastructure reduce the incomes they can pay even with similar technologies.
In the recent past Chinese companies have started to invest in overseas ports. Chinese investment has occurred in low income countries largely dependent on commodity exports but whose sustainable development also requires the development of manufacturing industries. Investment has also occurred in high income countries with large domestic markets. China’s own trade with these countries is large, and investments in port infrastructures can be expected not just to give a strong local short-term economic stimulus but also in the longer term to reduce trade costs and stimulate stronger economic development.
The aim of this research was to use macro-geographical methods to identify trends in export market economic potential, export supply capacity and the availability of imports for the countries in whose port development China has started to participate. At this very early stage the impacts of these investments lie mainly in the future. Trends in export potential, supply capacity and capital and intermediate goods availability are however causes as well as effects potentially contributing to virtuous spirals of circular and cumulative causation (see
Since its announcement in 2013 these Chinese investments have assumed roles in China’s BRI which aims to improve infrastructural and regulatory connectivity, increase international commerce and investment, establish growth poles and deepen and transform international economic co-operation. Investments in major infrastructures such as ports do of course carry risks: environmental risks associated with pollution and ecosystem damage, political risks as, for example, governments change and risks associated with debt. Managing these risks is a vital governance concern.
The gravity models with country fixed effects used to estimate exports and imports were particularly effective, accounting for extremely high shares of the variation in the independent variables. The coefficients were used to estimate export market potential, supply capacity and the availability of imported goods. In this period as a whole the volume of trade rose and fell with little overall increase in its current value, economically advanced economies largely stagnated and from the middle of this period commodity prices fell dramatically. Over the period as a whole the foreign market potential of these ports and countries increased, although it largely declined from 2012 to 2017. In this latter period, import demand potential increased. More strikingly, in 2008 to 2017 export supply capacity, which is an important driver of GDP per capita, increased in many of countries in which these ports are located, particularly in Southeast Asia and Sub-Saharan Africa. After 2012 these increases were especially striking and were also recorded in some parts of the Middle East and North Africa and in Europe. In a period in which the prices of fuels and minerals and metals fell, the low-income countries chosen for port construction projects saw increases in their share of world manufactured exports, suggesting that processes of industrialization were under way.
A number of other studies found positive impacts of infrastructure on trade and growth.
As emphasized on several occasions, the aim of this study was to identify the evolution of a number of drivers of trade and income. The economic potential indicators all reflect macroeconomic changes in port hinterlands that depend on far more than a particular infrastructural investment. No claims are therefore made about the impacts of these projects themselves. The study simply identifies some evolutions that are consistent with aspects of improved trade performance to which port infrastructures might contribute. Indeed, one might argue that it is the aspects of potential trade improvement that made the investments themselves attractive. Causes are often effects and effects are often causes.
Nor were any major comparative claims made: the evolution of the same indicators for the heterogeneous countries in which there are no Chinese overseas ports was not estimated, while comparisons with the same ports in the years up to 2008 would relate to a radically different global economic context. A number of comparisons were reported however in
This study does raise a number of questions about methodologies and in particular the estimation of gravity models. In economics a great deal of attention is paid to statistical issues associated with the estimation of gravity models. Almost all of these issues relate to deriving population estimates from random samples. One might hypothesize that the only sense in which recorded trade data is a sample is that trade is subject to measurement error. In that case issues do relate to the handling of missing values and the existence of zero trade flows.
Clearly long-term analyses of individual cases are required to explore causes and consequences of Chinese construction of, and investment in, overseas ports. A macro perspective is important as it enables cases to be placed in a wider context and enables some assessment of the representativeness/consistency of individual evolutions. The methods used in this research are of considerable value in examining this context, especially once projects have been completed. These methods could also be employed in a more comprehensive comparative study.
References
[1] Arvis JF, DuvalY, Shepherd B E N et al. Trade costs in the developing world: 1996-2010. World Trade Review, 15, 451-474(2016).
[2] BensassiS, Martinez-ZarzosoI, SuarezC. The effect of maritime transport costs on the extensive and intensive margins: Evidence from the Europe-Asia trade. Maritime Economics & Logistics, 16, 276-297(2014).
[3] BoskerM, GarretsenH. Economic geography and economic development in Sub-Saharan Africa. World Bank Economic Review, 26, 443-485(2012).
[4] BottassoA, ContiM, Porto P C D et al. Port infrastructures and trade: Empirical evidence from Brazil. Transportation Research Part A: Policy and Practice, 107, 126-139(2018).
[6] BrautigamD. Debt-trap diplomacy: The rise of a meme. Area Development and Policy, 5, 1-14(2020).
[7] Carey HC. Principles of Social Science. Philadelphia: J. R. Lippincott and Co.(18589).
[8] Chin GT. China's bold economic statecraft. Current History, 114, 217-223(2015).
[9] ClarkC. The Conditions of Economic Progress. London:. Macmillan.(1940).
[10] DucruetC, ItohH, JolyO. Ports and the local embedding of commodity flows. Papers in Regional Science, 94, 607-627(2015).
[11] DunfordM. The rise of China and its implications for economics and other developing countries: The significance of the Chinese social model. Area Development and Policy, 2, 124-129(2017).
[12] DunfordM, LiuW. Chinese perspectives on the Belt and Road Initiative. Cambridge Journal of Regions, Economy and Society, 12, 145-167(2019).
[13] DunfordM, YeungG. Development, regional, port-industrial complexes, 3, 271-280(2020).
[14] DunfordM, Liu WD, Liu, Z G et al. Geography, trade and regional development: The role of wage costs, exchange rates and currency/capital movements. Journal of Economic Geography, 14, 1175-1197(2014).
[15] Harris CD. The market as a factor in the localizatin of industry in the United States. Annals of the Association of American Geographers, 44, 315-348(1954).
[16] Heckman JJ. Sample selection bias as a specification error. Econometrica, 47, 153-161(1979).
[17] HelpmanE, MelitzM, RubinsteinY. Estimating trade flows: Trading partners and trading volumes. Quarterly Journal of Economics, 123, 441-487(2008).
[18] Lin JY. The rise of China and its implications for economics and other developing countries. Area Development and Policy,, 2, 109-119(2017).
[20] Liu WD, DunfordM. Inclusive globalization: Unpacking China’s Belt and Road Initiative. Area Development and Policy, 1, 323-340(2016).
[21] Liu ZG, SchindlerS, Liu WD. Demystifying Chinese overseas investment in infrastructure: Port development, the Belt and Road Initiative and regional development. Journal of Transport Geography, 87, 1-10(2020).
[22] LukermannF, Porter PW. Gravity and potential models in ecnomic-geography. Annals of the Association of American Geographers, 50, 493-504(1960).
[23] Munim ZH, Schramm HJ. The impacts of port infrastructure and logistics performance on economic growth: The mediating role of seaborne trade. Journal of Shipping and Trade,, 3, 1-19(2018).
[25] PoyhonenP. A tentative model for the volume of trade between countries. Weltwirtschaftliches Archiv: Review of World Economics, 90, 93-100(1963).
[26] Ravenstein EG. The laws of migration. Journal of the Royal Statistical Society, 48, 167-227(1885).
[27] Ravenstein EG. The laws of migration. Journal of the Royal Statistical Society, 52, 241-301(1889).
[28] ReddingS, Venables AJ. South-East Asian export performance: External market access and internal supply capacity. Journal of the Japanese and International Economies,, 17, 404-431(2003).
[29] ReddingS, Venables AJ. Economic geography and international inequality. Journal of International Economics,, 62, 53-82(2004).
[30] Redding, S, Venables A J. Geography and Export Performance: External Market Access and Internal Supply Capacity(2004).
[31] Reilly WJ. The Law of Retail Gravitation.(1931).
[32] RobinsonR. Ports as elements in value-driven chain systems: The new paradigm. Maritime Policy & Management, 29, 241-255(2002).
[33] Stewart JQ. Empirical mathematical rules concerning the distribution and equilibrium of population. Geographical Review, 37, 461-485(1947).
[34] TinbergenJ. An analysis of world trade flows. In: Tinbergen J (ed.). Shaping the World Economy(1962).
[36] WarntzW. Progress in economic geography. In: James P E (ed.), New Viewpoints in Geography (Twenty-Ninth Yearbook of the National Council for the Social Studies), 54-75(1959).
[37] Zipf GK. Human Behaviour and the Principle of Least Effort: An Introduction to Human Ecology. Cambridge, MA:. Addison-Wesley.(1949).


Set citation alerts for the article
Please enter your email address

© Copyright 2018-2021 | Chinese Laser Press. All Rights Reserved 沪ICP备15018463号-20