• Laser & Optoelectronics Progress
  • Vol. 56, Issue 23, 231402 (2019)
Jianian Yang1、**, Jianzhong Zhou1、*, Qi Sun1, Xiankai Meng1, Ming Zhu1, Zhaoheng Guo1, and Qiang Fu2
Author Affiliations
  • 1School of Mechanical Engineering, Jiangsu University, Zhenjiang, Jiangsu 212013, China
  • 2Nanjing Institute of Advanced Laser Technology, Nanjing, Jiangsu 210038, China
  • show less
    DOI: 10.3788/LOP56.231402 Cite this Article Set citation alerts
    Jianian Yang, Jianzhong Zhou, Qi Sun, Xiankai Meng, Ming Zhu, Zhaoheng Guo, Qiang Fu. Laser Paint Removal Process Parameter Optimization via Response Surface Methodology[J]. Laser & Optoelectronics Progress, 2019, 56(23): 231402 Copy Citation Text show less
    Diagram of laser paint removal
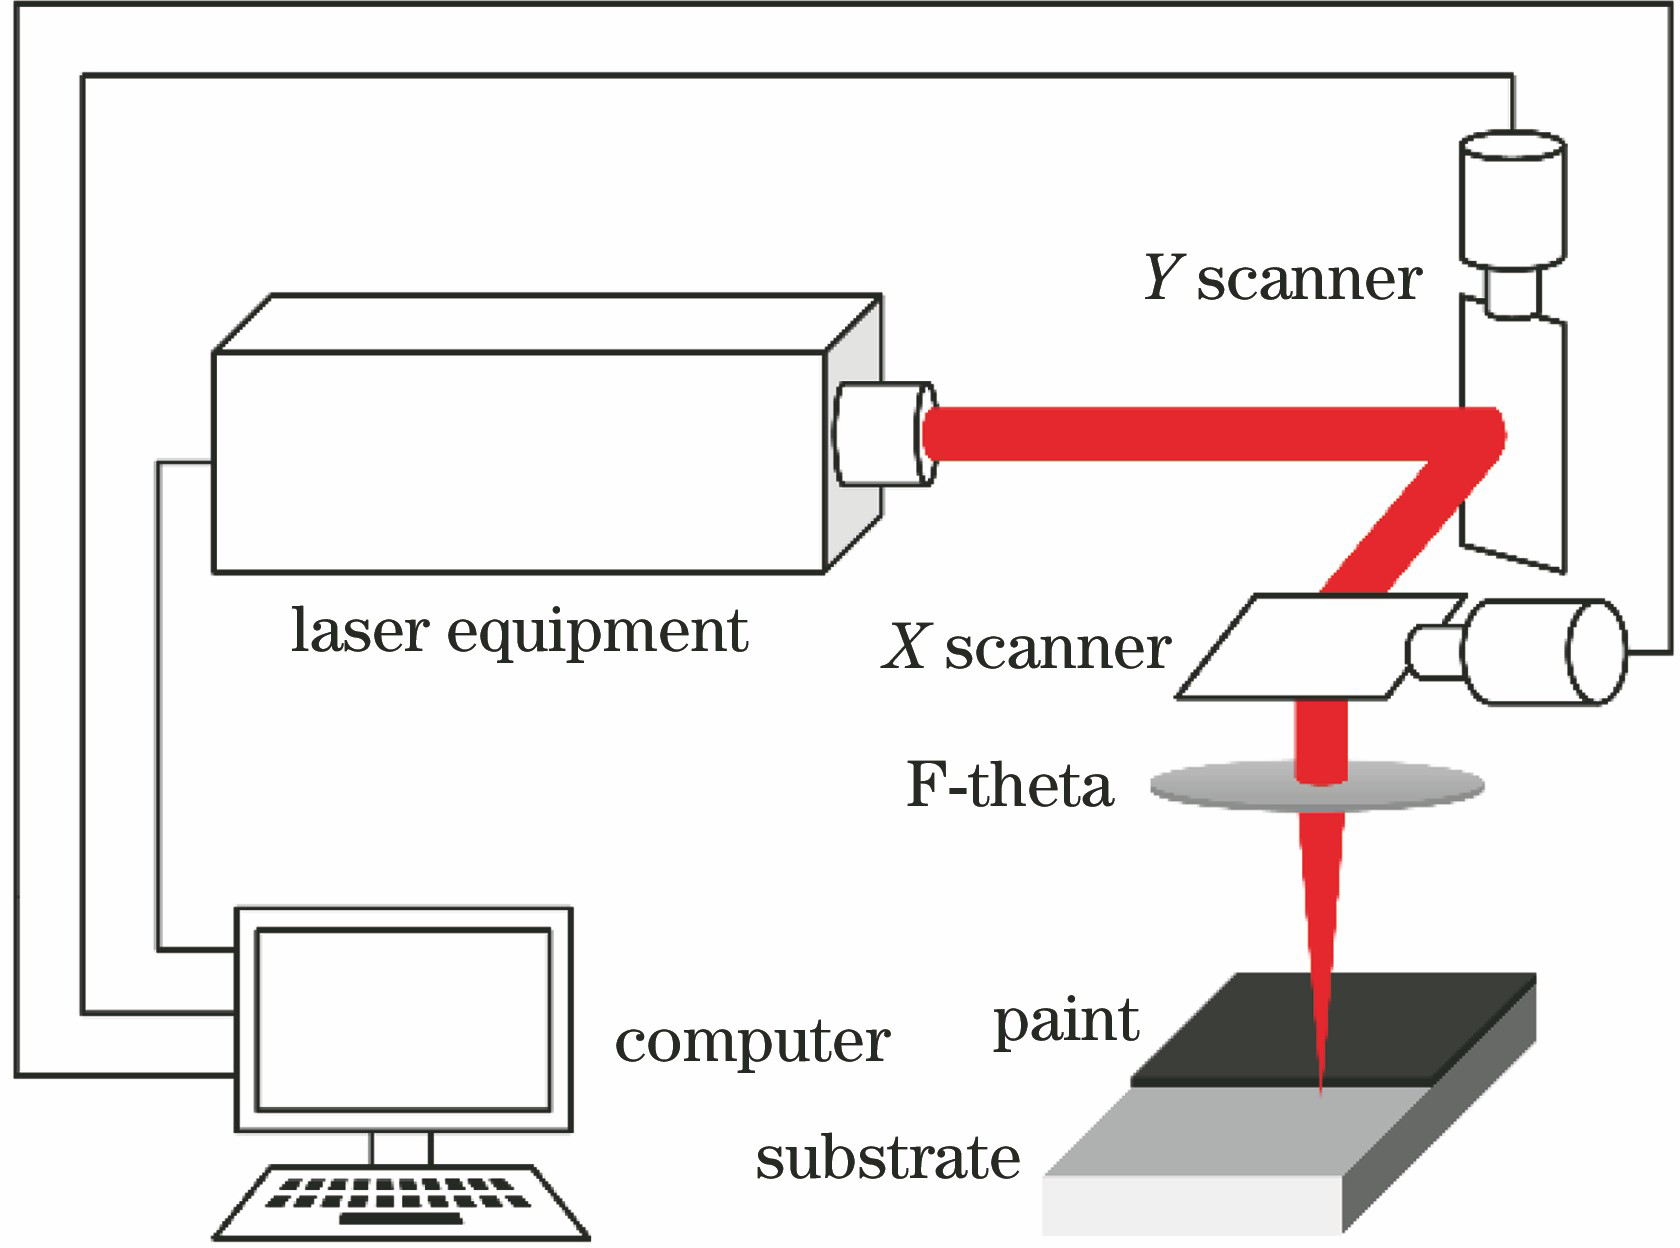
    Fig. 1. Diagram of laser paint removal
    Effect of interaction of all factors on surface composition
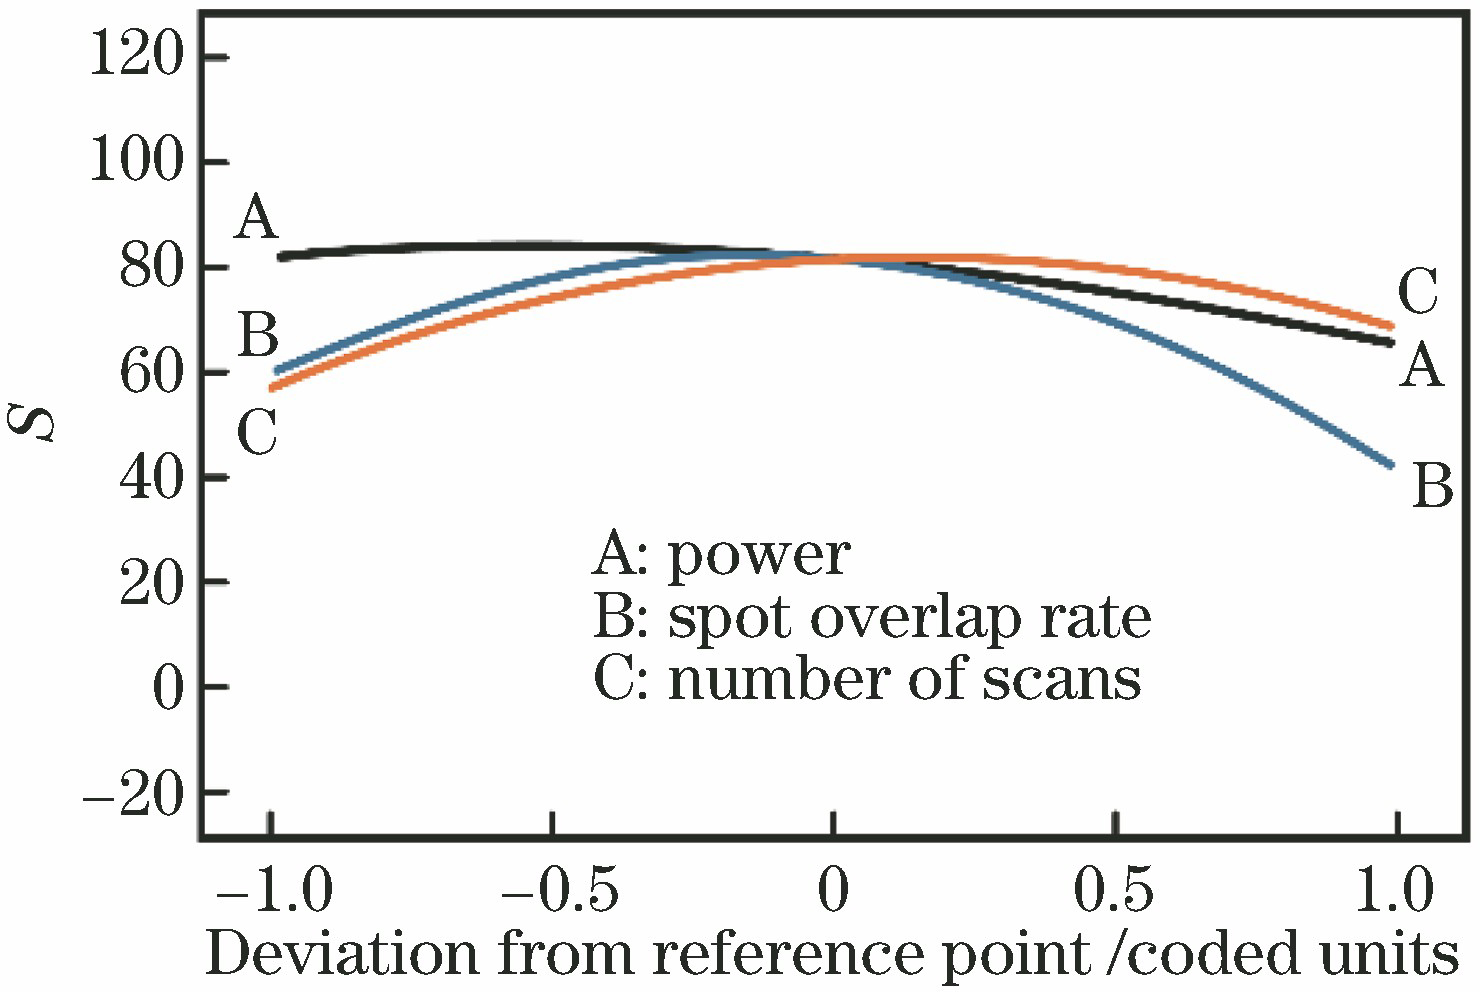
    Fig. 2. Effect of interaction of all factors on surface composition
    Cleaning surface micromorphology and elemental composition under different overlap rates. (a) 50%; (b) 75%
    Fig. 3. Cleaning surface micromorphology and elemental composition under different overlap rates. (a) 50%; (b) 75%
    Effects of spot overlap rate and power on surface composition. (a) Contour graph; (b) response graph
    Fig. 4. Effects of spot overlap rate and power on surface composition. (a) Contour graph; (b) response graph
    Effects of spot overlap rate and number of scans on surface composition. (a) Contour graph; (b) response graph
    Fig. 5. Effects of spot overlap rate and number of scans on surface composition. (a) Contour graph; (b) response graph
    Effect of interaction of all factors on surface roughness
    Fig. 6. Effect of interaction of all factors on surface roughness
    Cleaning surface micromorphology and line roughness at different powers. (a) 20 W; (b) 25 W
    Fig. 7. Cleaning surface micromorphology and line roughness at different powers. (a) 20 W; (b) 25 W
    Effects of power and number of scans on surface roughness. (a) Contour graph; (b) response graph
    Fig. 8. Effects of power and number of scans on surface roughness. (a) Contour graph; (b) response graph
    Effects of power and spot overlap rate on surface roughness. (a) Contour graph; (b) response graph
    Fig. 9. Effects of power and spot overlap rate on surface roughness. (a) Contour graph; (b) response graph
    ElementCSiMnCrNiSPNFe
    Mass fraction /%≤0.08≤1.0≤2.018.0-20.08.0-10.5≤0.03≤0.035≤0.1Bal.
    Table 1. Main chemical composition of 304 stainless steel
    ParameterValue
    Wavelength /nm1064
    Power /W≤ 100
    Pulse width /ns100
    Frequency /kHz10-100
    Scan speed /(mm·s-1)≤8000
    Focal length /mm160
    Waist diameter /mm0.05
    Table 2. Main technical parameters of laser paint removal system
    FactorExtreme value
    Low(-1)Medium(0)High(+1)
    Power P /W152025
    Spot overlap rate γ /%255075
    Number of scans N234
    Table 3. Experimental factors and level design
    No.ParameterResult
    P /Wγ /%NSSa /μm
    125253500.6966
    225502600.8036
    325753201.1528
    425504301.5258
    515502401.5620
    620503850.5980
    720503850.6330
    815504851.0620
    920503800.7070
    1020754101.0588
    1120503800.7860
    1220752201.0844
    1320503750.5900
    1420252300.8038
    1520254650.8788
    1615253400.9316
    1715753600.9498
    Table 4. Design matrix and experimental results
    SourceSum of squaresDegree of freedomMean squareFProbability
    Model10321.9991146.8916.620.0006
    P528.131528.137.650.0278
    γ703.131703.1310.190.0152
    625.001625.009.060.0197
    PN1406.2511406.2520.380.0027
    γN506.251506.257.340.0303
    γ23968.3813968.3857.520.0001
    N21592.8511592.8523.090.0020
    Lack of fit393.753131.255.890.0599
    Note: residual-square R2=0.9553; adjusted residual-square RAdj2=0.8978; predicted residual-square Rpred2=0.4040; adeq precision AP=11.479.
    Table 5. ANOVA for surface composition model
    SourceSum of squaresDegree of freedomMean squareFProbability
    Model1.3090.1425.260.0002
    γ0.1110.1119.170.0032
    0.04810.0488.420.0230
    PN0.3710.3765.52<0.0001
    P20.3210.3256.240.0001
    N20.3810.3866.34<0.0001
    Lack of fit0.01230.0040.600.6484
    Note: R2=0.9701, RAdj2=0.9317, Rpred2=0.8196, AP=15.336.
    Table 6. ANOVA for surface roughness model
    NameCriteriaWeight
    GoalLowerUpper
    PIn range15251
    γIn range25751
    NEqual to 3241
    SMaximize751001
    SaMinimize011
    Table 7. Optimization criteria and weight
    NumberP /Wγ /%NSSa /μm
    119.1846.06382.90.661
    Table 8. Optimization results
    Jianian Yang, Jianzhong Zhou, Qi Sun, Xiankai Meng, Ming Zhu, Zhaoheng Guo, Qiang Fu. Laser Paint Removal Process Parameter Optimization via Response Surface Methodology[J]. Laser & Optoelectronics Progress, 2019, 56(23): 231402
    Download Citation