
Ruoyu Tang, Song Qiu, Tong Liu, Xiuqian Li, Zhengliang Liu, Yuan Ren. Optimized Measurement of Optical Rotational Doppler Shift Using Dual Fourier Analysis[J]. Acta Optica Sinica, 2023, 43(7): 0726002
- Acta Optica Sinica
- Vol. 43, Issue 7, 0726002 (2023)
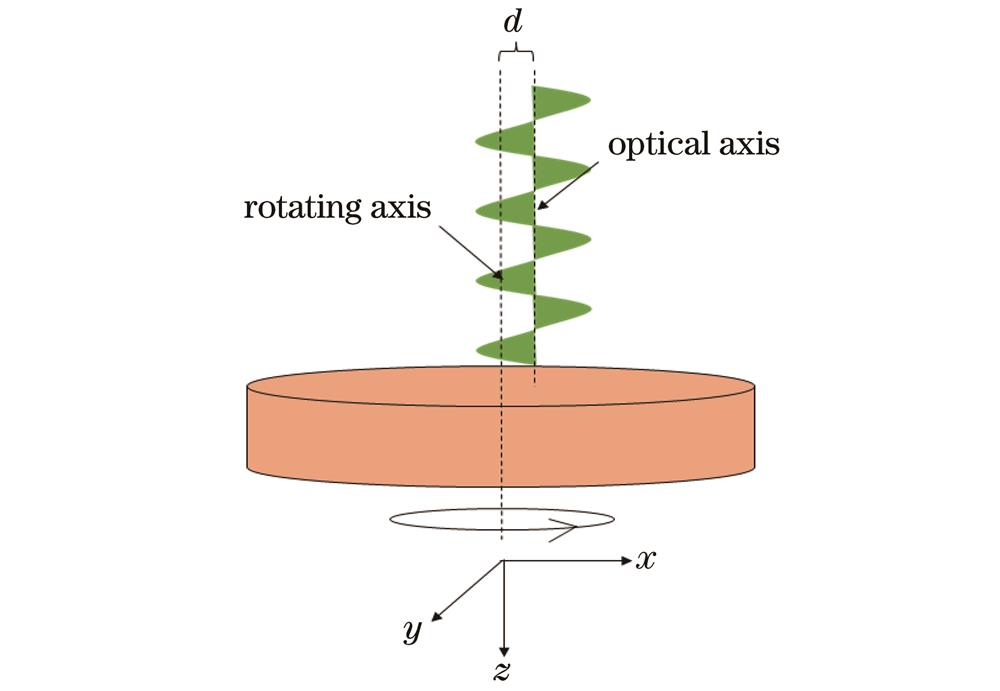
Fig. 1. Sketch map of lateral displacement of vortex beam optical axis

Fig. 2. Simulation results of OAM decomposition. (a) Superposition-mode LG beam with
Fig. 3. Experimental setup of measurement of RDE
Fig. 4. Light intensity distributions collected by CCD (
Fig. 5. Results of dual Fourier analysis of signal by using impure optical vortex. Primary frequency spectra at (a) ω=30 Hz, (c) ω=40 Hz, and (e) ω=50 Hz; secondary frequency spectra at (b) ω=30 Hz, (d) ω=40 Hz, and (f) ω=50 Hz
Fig. 6. Results of dual Fourier analysis of signal by using vortex beam with lateral displacement. Primary frequency spectra at (a) ω=30 Hz, (c) ω=40 Hz, and (e) ω=50 Hz; secondary frequency spectra at (b) ω=30 Hz, (d) ω=40 Hz, and (f) ω=50 Hz
Fig. 7. Results of dual Fourier analysis of signal by using vortex beam with half of it missing. Primary frequency spectra at (a) ω=30 Hz, (c) ω=40 Hz, and (e) ω=50 Hz; secondary frequency spectra at (b) ω=30 Hz, (d) ω=40 Hz, and (f) ω=50 Hz


Set citation alerts for the article
Please enter your email address

© Copyright 2018-2021 | Chinese Laser Press. All Rights Reserved 沪ICP备15018463号-20