
Marco Seminara, Marco Meucci, Fabio Tarani, Cristiano Riminesi, Jacopo Catani. Characterization of a VLC system in real museum scenario using diffusive LED lighting of artworks[J]. Photonics Research, 2021, 9(4): 548
- Photonics Research
- Vol. 9, Issue 4, 548 (2021)
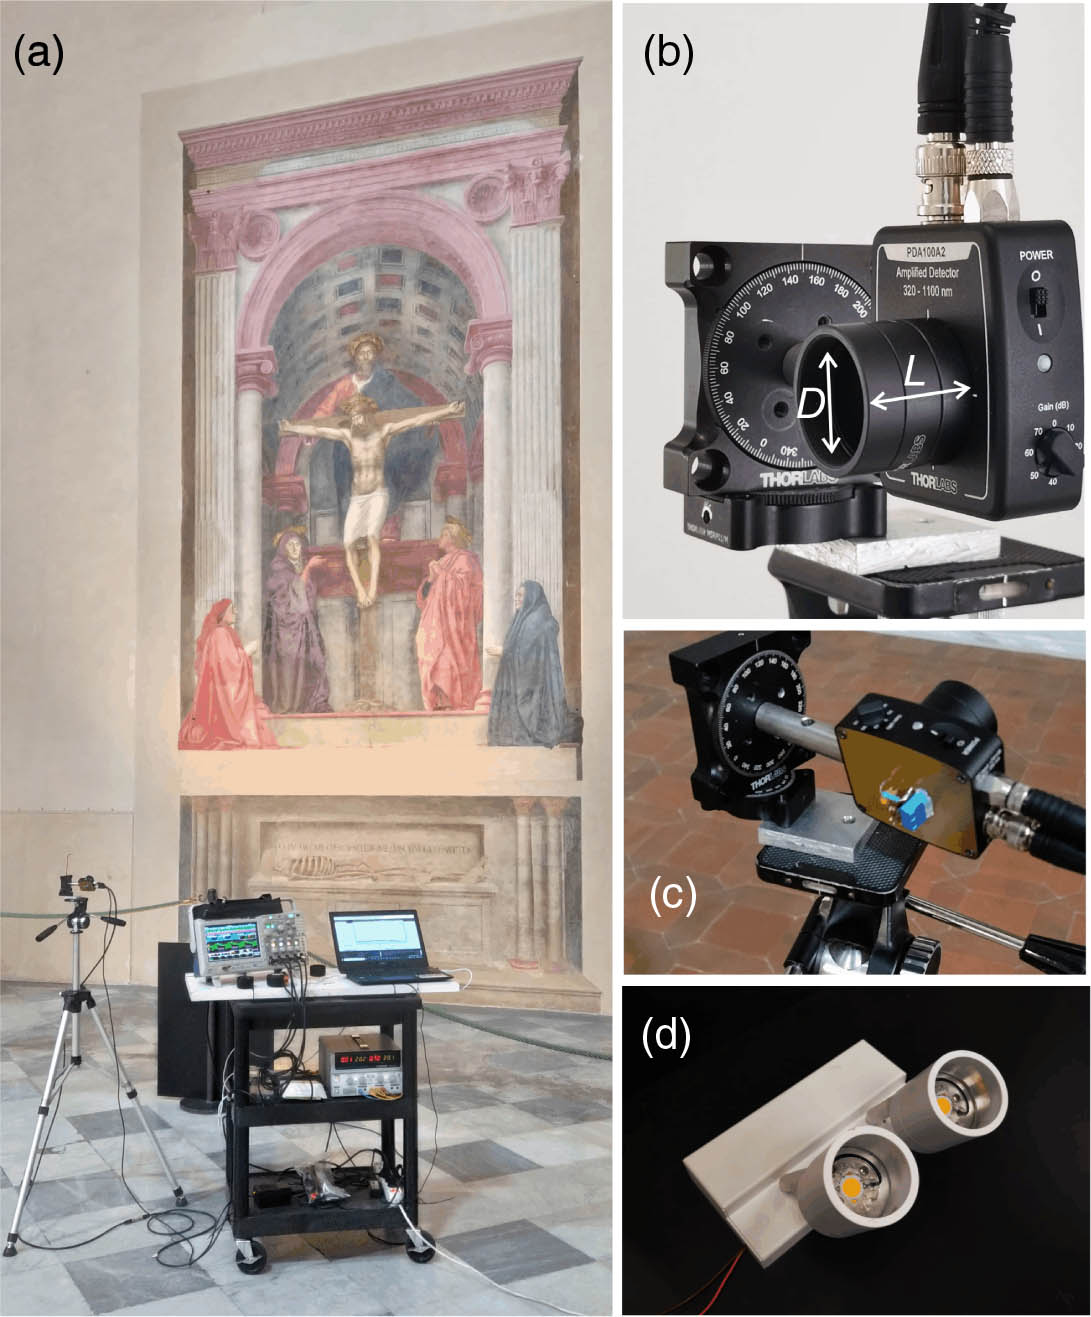
Fig. 1. (a) Example of test setup for VLC links in museum environment; (b) and (c) receiving stage; (d) the LED lamps used for VLC transmission.
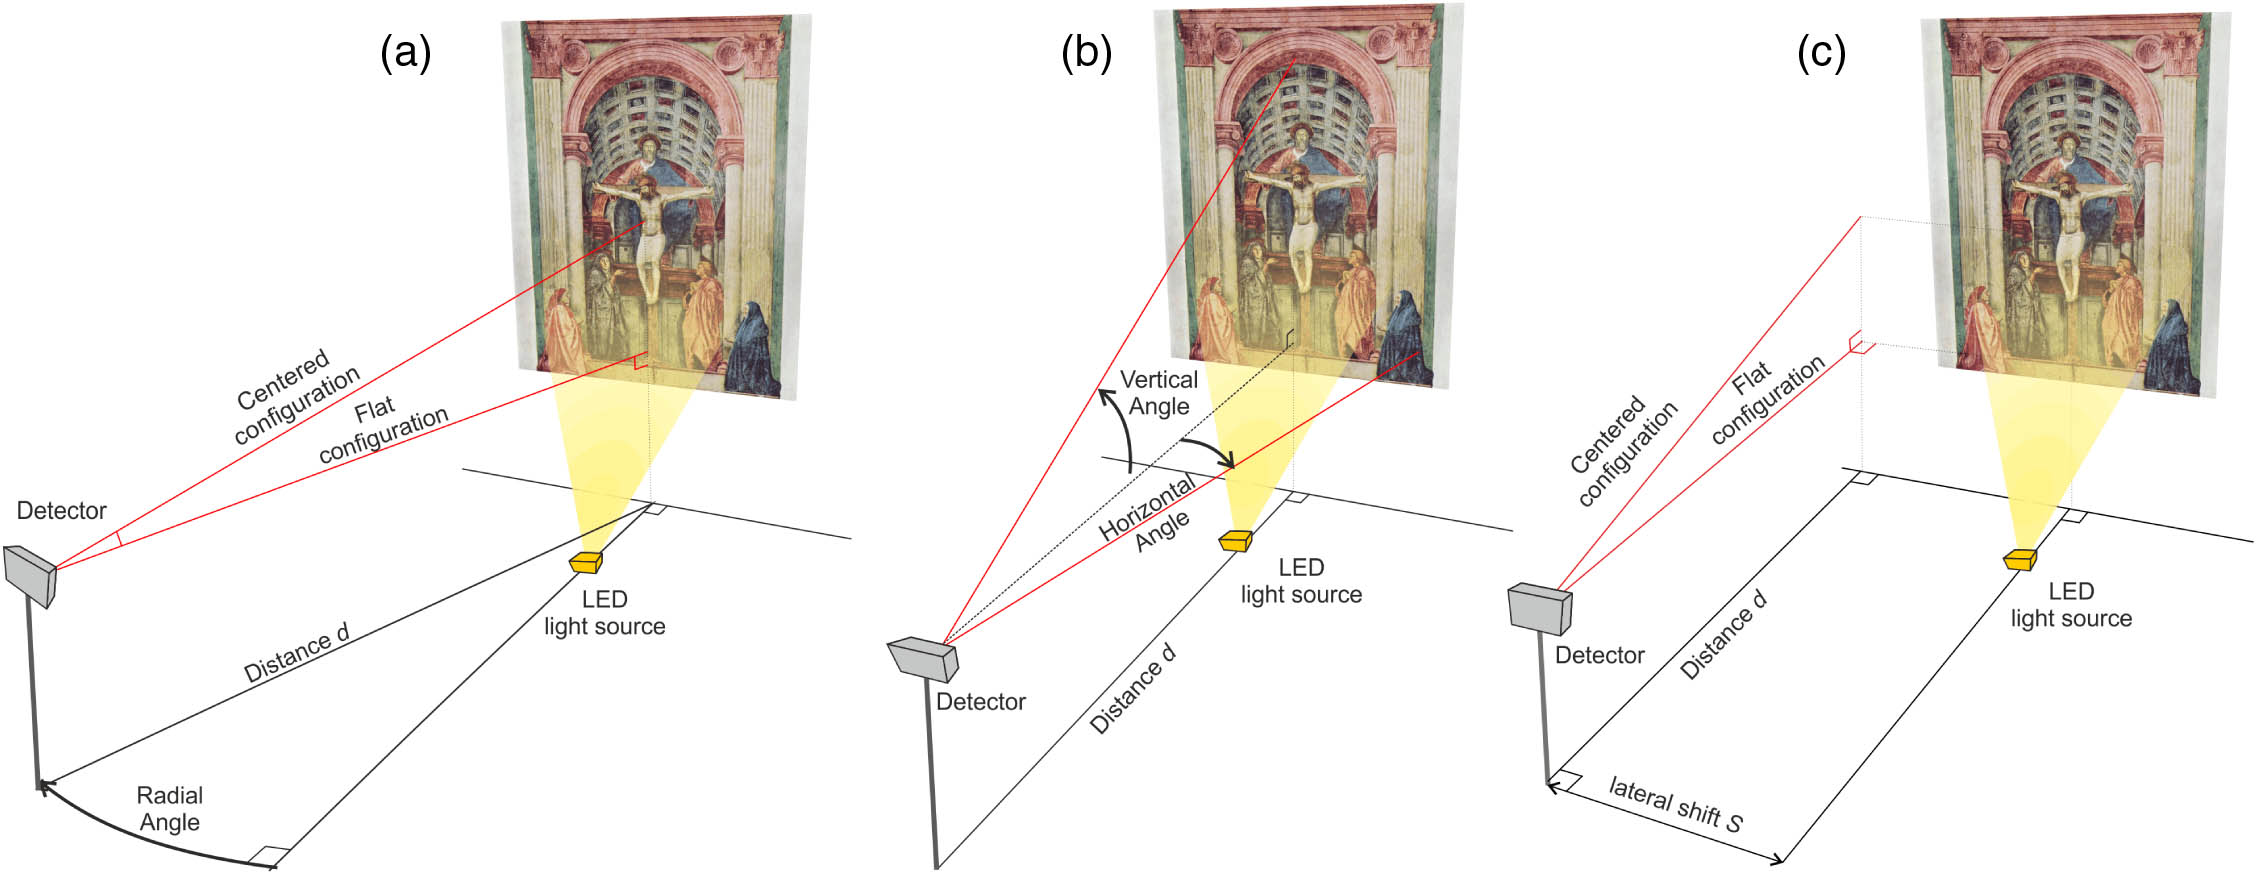
Fig. 2. Sketch of the experimental campaign. A custom detector is placed at various distances/angles from a specific artwork. The three panels represent different measurement configurations: (a) polar measurement, (b) FoV characterization, and (c) evaluation of lateral shift influence. The centered configuration is obtained aiming the detector’s optical axis toward the geometrical center of the painting; in the flat configuration the detector’s optical axis is parallel to the floor.
Fig. 3. Experimental SNR maps recorded for (a) Trinity—a wall painting by Masaccio; (b) Resurrection with Four Saints—a canvas by Vasari, and (c) St. Raymond of Penyafort Resurrects a Child—a wood painting by Ligozzi. Data are taken in both centered and flat configurations (see text). Black dots represent the actual measurement grid, whereas the color maps show a heuristic spline interpolation to the data.
Fig. 4. PER maps as a function of the radial angle for the three artworks measured at distances of 4 and 6 m: (a) wall painting by Masaccio; (b) canvas by Vasari; (c) wood painting by Ligozzi. The dots represent the experimental data, with a statistical average error (where not shown the error bars are masked by symbol size). The lines are a spline interpolation placed as a guide to the eye. The green and red color codes represent the centered and flat configurations, respectively (see text).
Fig. 5. Experimental determination of TFoV values. Data report the PER values recorded for the wall painting by Masaccio, by scanning the (a) horizontal and (b) vertical angular positions of the optical axis of the Rx [see also Fig. 2 (b)].
Fig. 6. Effects on the VLC transmission of a lateral shift in the RX position in front of the wall painting by Masaccio. Data points show the measured PER for the flat (green symbols) and centered (blue symbols) configurations.
|
Table 1. Three Different Masterpieces Analyzed in the Experimental Campaign
| ||||||||||||||||||||||||
Table 2. Measured SNR Values in Relevant Positions in Front of the Three Artworksa
| |||||||||||||||||||||||||||||
Table 3. Measured PER Values in Relevant Positions near the Three Artworksa
| ||||||||||||||||||||||||
Table 4. Experimental Maximum View Angles Featuring PER

Set citation alerts for the article
Please enter your email address
© Copyright 2018-2021 | Chinese Laser Press. All Rights Reserved 沪ICP备15018463号-20