• Photonics Research
  • Vol. 8, Issue 6, 986 (2020)
Qiao Jiang1, Yanjun Bao1, Jing Li2, Lifeng Tian2, Tong Cui3, Lin Sun3, Bowen Du1, Bowen Li1, Benfeng Bai3, Jia Wang3, Hongbo Sun3, Bo Shen1、4, Han Zhang1, Feng Lin1, Xing Zhu1, and Zheyu Fang1、4、*
Author Affiliations
  • 1School of Physics, State Key Laboratory for Mesoscopic Physics, Academy for Advanced Interdisciplinary Studies, and Nano-optoelectronics Frontier Center of Ministry of Education, Peking University, Beijing 100871, China
  • 2Key Laboratory of Photochemical Conversion and Optoelectronic Materials, Technical Institute of Physics and Chemistry, Chinese Academy of Sciences, Beijing 100190, China
  • 3State Key Laboratory of Precision Measurement Technology and Instruments, Department of Precision Instruments, Tsinghua University, Beijing 100084, China
  • 4Collaborative Innovation Center of Quantum Matter, Beijing, China
  • show less
    DOI: 10.1364/PRJ.385099 Cite this Article Set citation alerts
    Qiao Jiang, Yanjun Bao, Jing Li, Lifeng Tian, Tong Cui, Lin Sun, Bowen Du, Bowen Li, Benfeng Bai, Jia Wang, Hongbo Sun, Bo Shen, Han Zhang, Feng Lin, Xing Zhu, Zheyu Fang. Bi-channel near- and far-field optical vortex generator based on a single plasmonic metasurface[J]. Photonics Research, 2020, 8(6): 986 Copy Citation Text show less
    Bi-channel optical vortex generated in both the near and far fields. (a) Schematic of NFVG that is based on a plasmonic metasurface which consists of a nanoslit array. (b) The nanoslit on an Au film works as the building block of NFVG with width W=80 nm, length L=250 nm, and depth T=120 nm. The depth T is also the thickness of the Au film. (c) Schematic diagram that illustrates the design principle of the bi-channel metasurface using geometric phase of the nanoslit in both the near and far fields. Under illumination of CP light with a specific spin state (LCP/RCP), the proposed metasurface can simultaneously generate focused SP vortex at the center (point O) of the metasurface and focused far-field vortex (cross-polarization, RCP/LCP) of scattered light at point F with a designed focal length f.
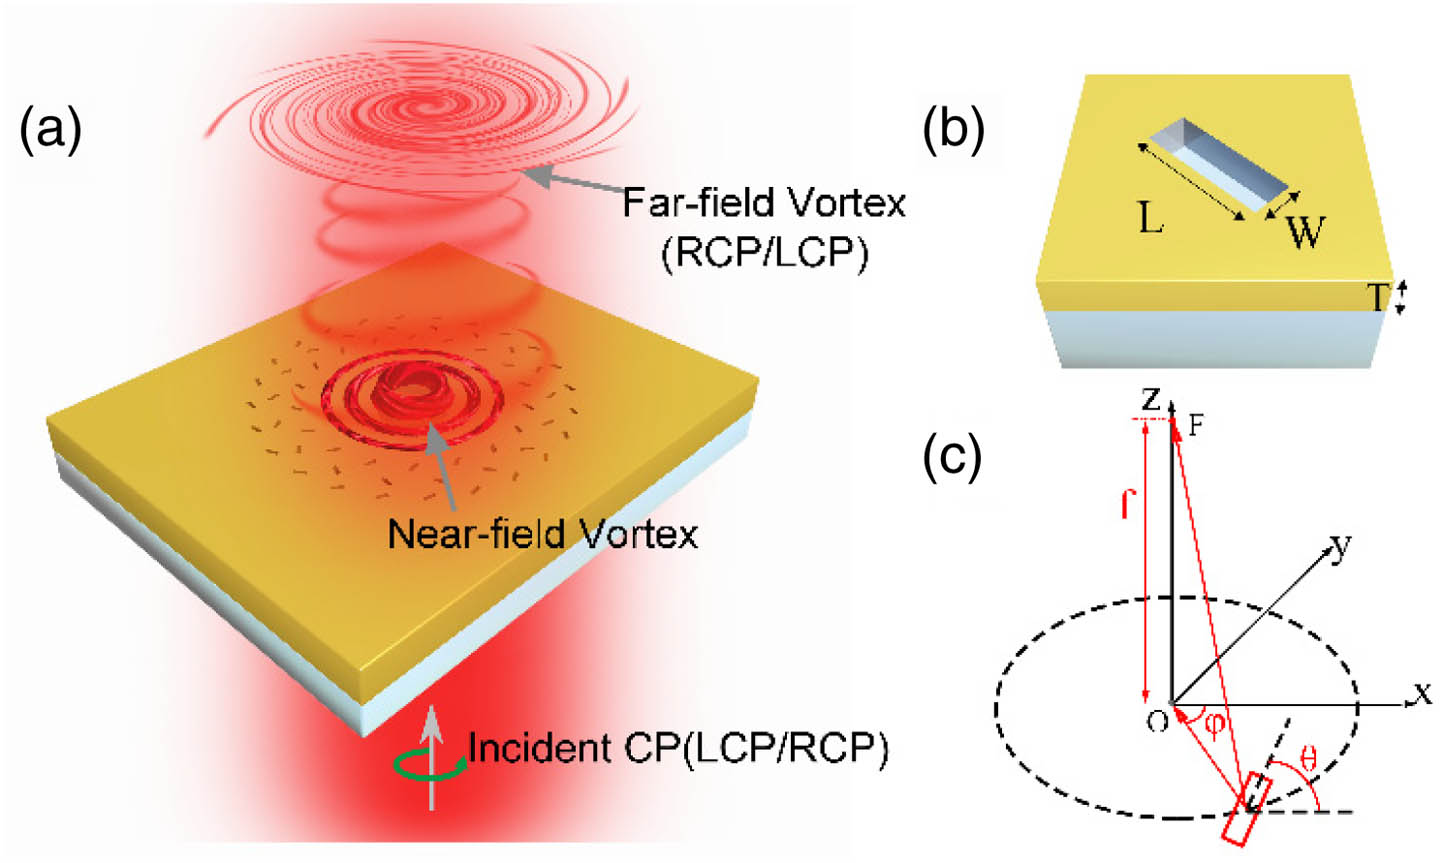
    Fig. 1. Bi-channel optical vortex generated in both the near and far fields. (a) Schematic of NFVG that is based on a plasmonic metasurface which consists of a nanoslit array. (b) The nanoslit on an Au film works as the building block of NFVG with width W=80  nm, length L=250  nm, and depth T=120  nm. The depth T is also the thickness of the Au film. (c) Schematic diagram that illustrates the design principle of the bi-channel metasurface using geometric phase of the nanoslit in both the near and far fields. Under illumination of CP light with a specific spin state (LCP/RCP), the proposed metasurface can simultaneously generate focused SP vortex at the center (point O) of the metasurface and focused far-field vortex (cross-polarization, RCP/LCP) of scattered light at point F with a designed focal length f.
    NFVG design and the simulation results. (a) The nanoslit array of a designed NFVG that can generate SP vortex and far-field vortex with topological charge of l1=3 and l2=2 under illumination of LCP light at 671 nm, respectively. The inner radius R1 and outer radius R2 are set to be 3.5 and 9 μm, and the distance between two adjacent nanoslits is d=450 nm. (b) Simulated optical far-field intensity of cross-polarized light (i.e., RCP light) at the xz plane. The inset shows the intensity distribution at the focal xy plane (z=20 μm). (c) Simulated |Ez|2 intensity distribution of SPPs in the near field on the surface of Au film. Simulated results of (d) instantaneous vortex field distribution and (e) spatial phase profile at z=20 μm in the far field, respectively. Simulated results of (f) instantaneous Ez intensity distribution and (g) spatial phase profile for SPPs in the near field, respectively.
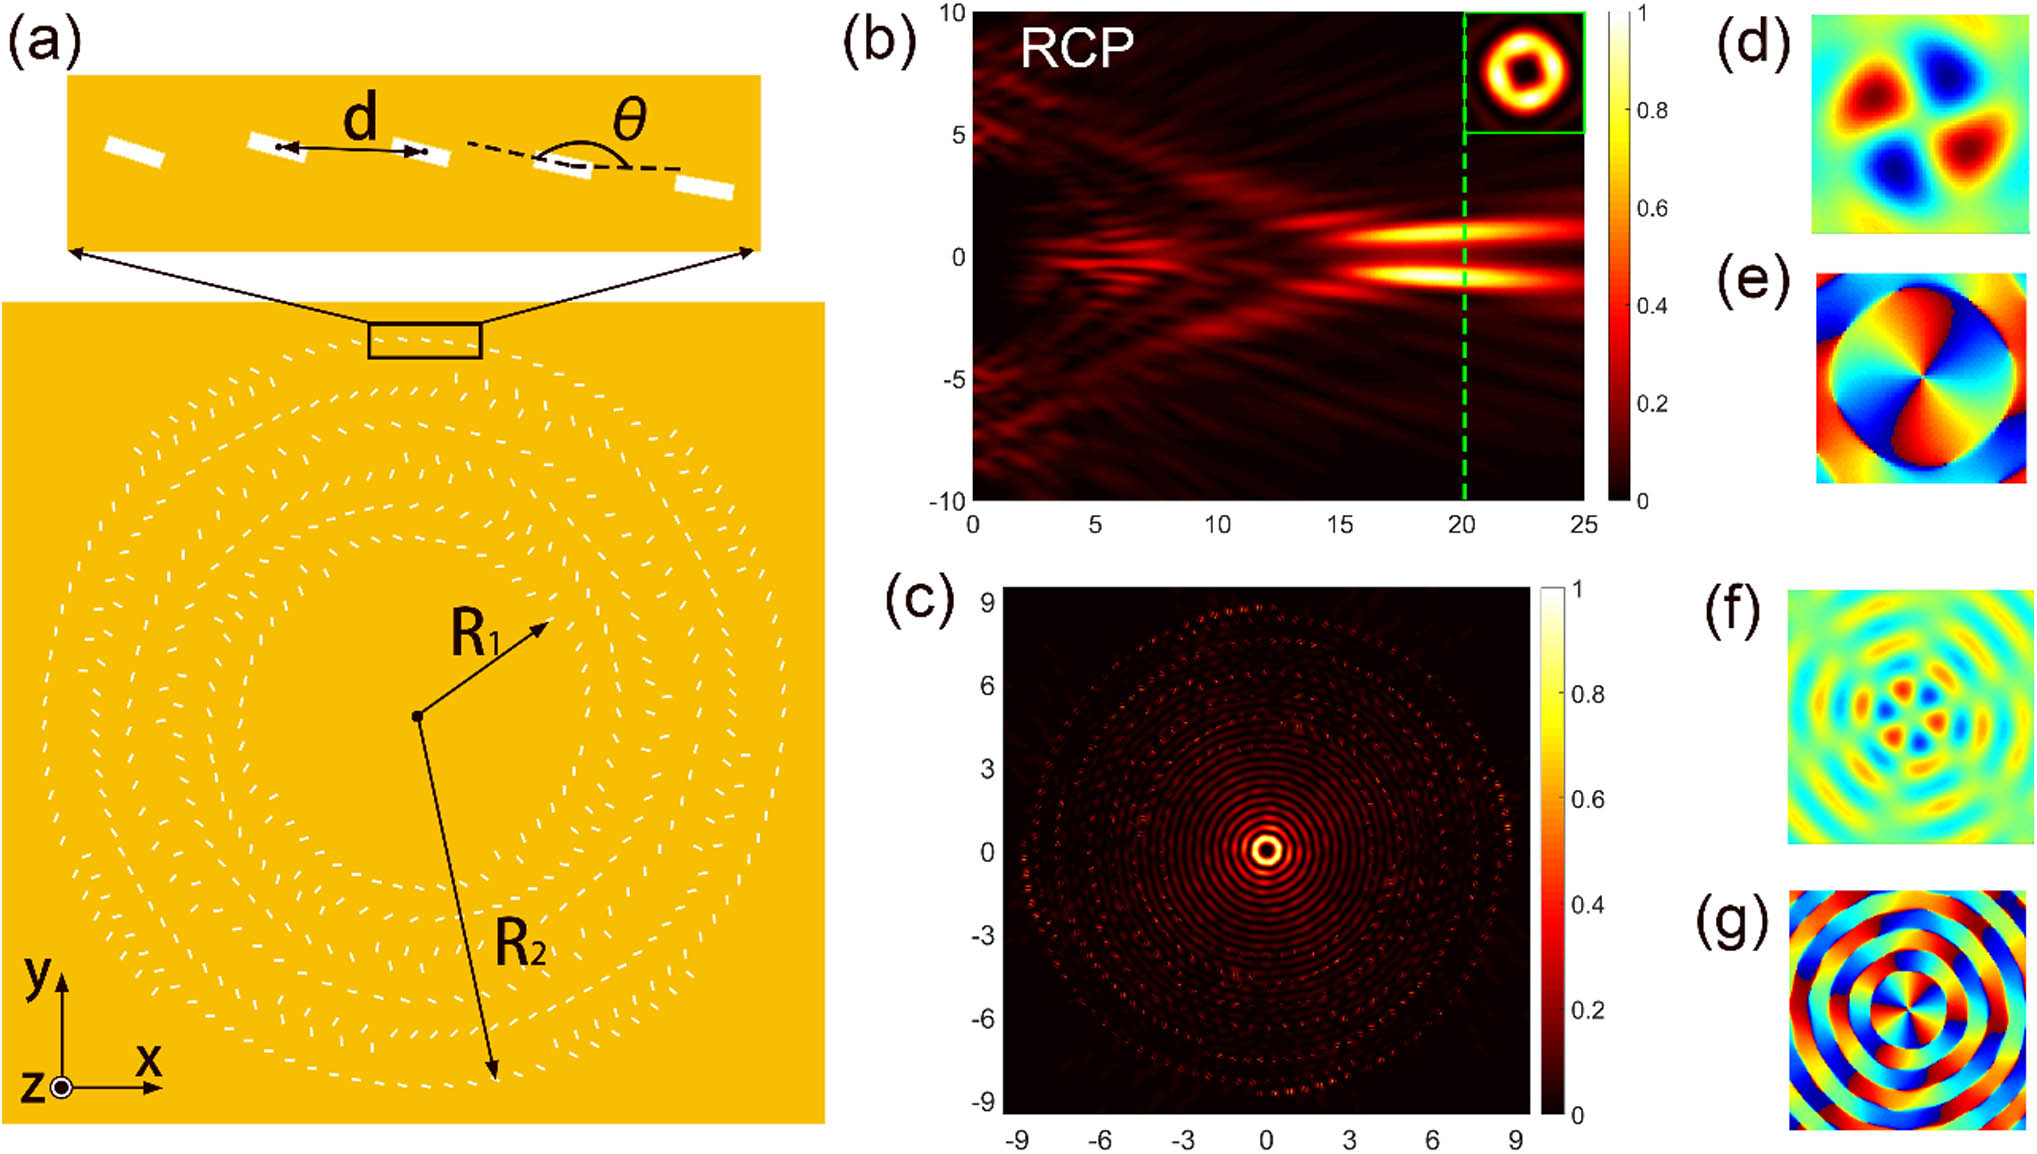
    Fig. 2. NFVG design and the simulation results. (a) The nanoslit array of a designed NFVG that can generate SP vortex and far-field vortex with topological charge of l1=3 and l2=2 under illumination of LCP light at 671 nm, respectively. The inner radius R1 and outer radius R2 are set to be 3.5 and 9 μm, and the distance between two adjacent nanoslits is d=450  nm. (b) Simulated optical far-field intensity of cross-polarized light (i.e., RCP light) at the xz plane. The inset shows the intensity distribution at the focal xy plane (z=20  μm). (c) Simulated |Ez|2 intensity distribution of SPPs in the near field on the surface of Au film. Simulated results of (d) instantaneous vortex field distribution and (e) spatial phase profile at z=20  μm in the far field, respectively. Simulated results of (f) instantaneous Ez intensity distribution and (g) spatial phase profile for SPPs in the near field, respectively.
    Experimental results of optical performances for the NFVG in the near and far fields with LCP incidence. (a) Scanning electron microscopy (SEM) images of the fabricated NFVG sample. The magnified SEM image shows the appearance of a single nanoslit. The scale bar is 5 μm. (b) Experimentally measured far-field intensity of cross-polarized light (RCP light) at the xz plane. The inset shows the intensity distribution at the focal xy plane (z=20 μm) marked with a white dashed line in xz profile. (c) Measured x-component of transmitted light at z=30 μm. (d) SNOM measured optical near-field intensity distribution. Inset shows the zoom-in image of SPPs distribution at the center of the metasurface. (e) Comparison of the intensity profiles between measurement and simulation. The black dashed line corresponds to the simulation result. The blue and green solid lines show the field intensity along the blue and green dashed lines (i.e., x and y directions) in the SNOM result (d), respectively.
    Fig. 3. Experimental results of optical performances for the NFVG in the near and far fields with LCP incidence. (a) Scanning electron microscopy (SEM) images of the fabricated NFVG sample. The magnified SEM image shows the appearance of a single nanoslit. The scale bar is 5 μm. (b) Experimentally measured far-field intensity of cross-polarized light (RCP light) at the xz plane. The inset shows the intensity distribution at the focal xy plane (z=20  μm) marked with a white dashed line in xz profile. (c) Measured x-component of transmitted light at z=30  μm. (d) SNOM measured optical near-field intensity distribution. Inset shows the zoom-in image of SPPs distribution at the center of the metasurface. (e) Comparison of the intensity profiles between measurement and simulation. The black dashed line corresponds to the simulation result. The blue and green solid lines show the field intensity along the blue and green dashed lines (i.e., x and y directions) in the SNOM result (d), respectively.
    Flexibility of the proposed NFVG for different topological charge configurations. Results of the sample designed for near- and far-field topological charges of (a) l1=2, l2=3 (Sample A), (b) l1=2, l2=2 (Sample B), and (c) l1=3, l2=2 (Sample C). Experimentally measured optical far-field intensity distributions on the transmission side of the metasurface for (a1), (b1), (c1) focal xy plane (z=20 μm); (a3), (b3), (c3) cross-sectional planes; and (a2), (b2), (c2) x-component at z=30 μm. The left of (a3)–(c3) shows the SEM images of these three samples. (a4), (b4), (c4) SNOM measured optical near-field intensity distributions for Samples A, B, and C. (a5), (b5), (c5) Simulated instantaneous Ez intensity distributions of SPPs in the near field for Samples A, B, and C. For all simulations and experimental measurements in (a)–(c), the incident beam is LCP light of 671 nm, and the results in (a1)–(c1) and (a3)–(c3) have filtered out the component of initial polarization to measure the cross-polarized light.
    Fig. 4. Flexibility of the proposed NFVG for different topological charge configurations. Results of the sample designed for near- and far-field topological charges of (a) l1=2, l2=3 (Sample A), (b) l1=2, l2=2 (Sample B), and (c) l1=3, l2=2 (Sample C). Experimentally measured optical far-field intensity distributions on the transmission side of the metasurface for (a1), (b1), (c1) focal xy plane (z=20  μm); (a3), (b3), (c3) cross-sectional planes; and (a2), (b2), (c2) x-component at z=30  μm. The left of (a3)–(c3) shows the SEM images of these three samples. (a4), (b4), (c4) SNOM measured optical near-field intensity distributions for Samples A, B, and C. (a5), (b5), (c5) Simulated instantaneous Ez intensity distributions of SPPs in the near field for Samples A, B, and C. For all simulations and experimental measurements in (a)–(c), the incident beam is LCP light of 671 nm, and the results in (a1)–(c1) and (a3)–(c3) have filtered out the component of initial polarization to measure the cross-polarized light.
    Schematic of the experimental setup for far-field measurement. The incident CP light is generated by a polarizer and a QWP. With an actuator, the far-field intensity distribution at different distances can be collected by the CMOS camera. In this work, the incidence is LCP light, and the cross-polarized light (RCP) is measured in the far field.
    Fig. 5. Schematic of the experimental setup for far-field measurement. The incident CP light is generated by a polarizer and a QWP. With an actuator, the far-field intensity distribution at different distances can be collected by the CMOS camera. In this work, the incidence is LCP light, and the cross-polarized light (RCP) is measured in the far field.
    SEM images and far-field simulated results of Samples A and B. SEM images of fabricated (a) Sample A and (b) Sample B with FIB milling process. (c)–(h) Simulated far-field intensity distribution of RCP at the xz plane and corresponding intensity and phase distribution at the xy plane (z=20 μm) for Sample A [(c), (e), and (f)] and Sample B [(d), (g), and (h)].
    Fig. 6. SEM images and far-field simulated results of Samples A and B. SEM images of fabricated (a) Sample A and (b) Sample B with FIB milling process. (c)–(h) Simulated far-field intensity distribution of RCP at the xz plane and corresponding intensity and phase distribution at the xy plane (z=20  μm) for Sample A [(c), (e), and (f)] and Sample B [(d), (g), and (h)].
    Simulated near-field results of Samples A and B. Simulated near-field intensity distributions of (a), (b) Sample A and (d), (e) Sample B. The simulated phase distribution of near-field SPPs of (c) Sample A and (f) Sample B. The similarity of the near-field intensity and phase distribution of these two samples confirmed the generating of near-field vortex with the same topological charge of l1=2 as designed.
    Fig. 7. Simulated near-field results of Samples A and B. Simulated near-field intensity distributions of (a), (b) Sample A and (d), (e) Sample B. The simulated phase distribution of near-field SPPs of (c) Sample A and (f) Sample B. The similarity of the near-field intensity and phase distribution of these two samples confirmed the generating of near-field vortex with the same topological charge of l1=2 as designed.
    Comparison of experimental results and simulations. (a) The intensity profile of experimental results (along the white dashed line in the inset) and simulations (along the x direction of intensity distribution shown in Fig. 7) of Sample A (l1=2, l2=3). (b) The intensity profile of experimental results (along the white dashed line in the inset) and simulations of Sample B (l1=2, l2=2). Blue dashed lines represent simulated results and the orange ones represent experimentally measured results. The measured profiles are 0.596 μm (Sample A) and 0.656 μm (Sample B), and are close to the simulation results 0.640 μm, which confirms that the generated near-field vortex has a topological charge of 2 as designed.
    Fig. 8. Comparison of experimental results and simulations. (a) The intensity profile of experimental results (along the white dashed line in the inset) and simulations (along the x direction of intensity distribution shown in Fig. 7) of Sample A (l1=2, l2=3). (b) The intensity profile of experimental results (along the white dashed line in the inset) and simulations of Sample B (l1=2, l2=2). Blue dashed lines represent simulated results and the orange ones represent experimentally measured results. The measured profiles are 0.596 μm (Sample A) and 0.656 μm (Sample B), and are close to the simulation results 0.640 μm, which confirms that the generated near-field vortex has a topological charge of 2 as designed.
    Simulated results of the bi-channel metalens under LCP incidence. (a) Designed patterns of the bi-channel metalens. (b) Simulated near-field intensity distribution. (c) Simulated far-field intensity distribution of RCP at the xz plane. (d) Simulated far-field intensity distribution at the xy plane [green dashed line in (c)].
    Fig. 9. Simulated results of the bi-channel metalens under LCP incidence. (a) Designed patterns of the bi-channel metalens. (b) Simulated near-field intensity distribution. (c) Simulated far-field intensity distribution of RCP at the xz plane. (d) Simulated far-field intensity distribution at the xy plane [green dashed line in (c)].
    Simulated near- and far-field distributions of NFVG with different configurations of l1 and l2 under LCP incidence. (a) Designed patterns with different topological charges l1 (0 to 6) and l2 (6 to 0). (b) Simulated intensity (upper row) and instantaneous field (lower row) distributions of near-field vortices with different topological charges. (c) Simulated intensity (upper row) and instantaneous field (lower row) distributions of far-field vortices (RCP) with different topological charges.
    Fig. 10. Simulated near- and far-field distributions of NFVG with different configurations of l1 and l2 under LCP incidence. (a) Designed patterns with different topological charges l1 (0 to 6) and l2 (6 to 0). (b) Simulated intensity (upper row) and instantaneous field (lower row) distributions of near-field vortices with different topological charges. (c) Simulated intensity (upper row) and instantaneous field (lower row) distributions of far-field vortices (RCP) with different topological charges.
    Qiao Jiang, Yanjun Bao, Jing Li, Lifeng Tian, Tong Cui, Lin Sun, Bowen Du, Bowen Li, Benfeng Bai, Jia Wang, Hongbo Sun, Bo Shen, Han Zhang, Feng Lin, Xing Zhu, Zheyu Fang. Bi-channel near- and far-field optical vortex generator based on a single plasmonic metasurface[J]. Photonics Research, 2020, 8(6): 986
    Download Citation