
Xiao-hong ZHANG, Xue-song JIANG, Fei SHEN, Hong-zhe JIANG, Hong-ping ZHOU, Xue-ming HE, Dian-cheng JIANG, Yi ZHANG. Design of Portable Flour Quality Safety Detector Based on Diffuse Transmission Near-Infrared Spectroscopy[J]. Spectroscopy and Spectral Analysis, 2022, 42(4): 1235
- Spectroscopy and Spectral Analysis
- Vol. 42, Issue 4, 1235 (2022)
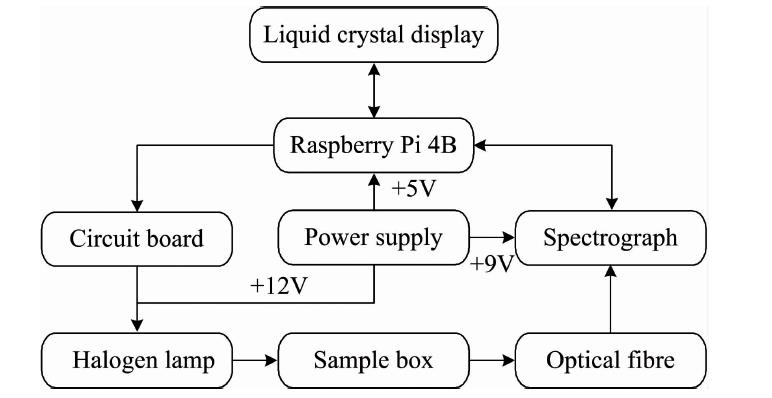
Fig. 1. Working principle of detection system
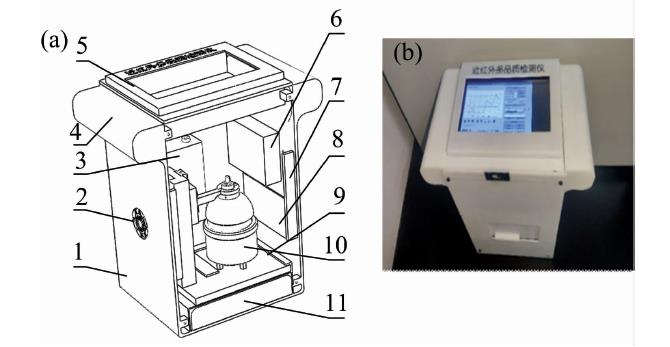
Fig. 2. Schematic diagram of device hardware
(a): Instrument strumcture diagram; (b): Physical drawing of instrument 1: Shell; 2: Vent; 3: Micro spectrometer; 4: Grip; 5: Upper cover and touch screen; 6: Raspberry Pi 4B; 7: Lug boss; 8: Light source control circuit board; 9: Card slot; 10: Testing accessories; 11: Power Supply
(a): Instrument strumcture diagram; (b): Physical drawing of instrument 1: Shell; 2: Vent; 3: Micro spectrometer; 4: Grip; 5: Upper cover and touch screen; 6: Raspberry Pi 4B; 7: Lug boss; 8: Light source control circuit board; 9: Card slot; 10: Testing accessories; 11: Power Supply
Fig. 3. Test accessories
1: Objective table; 2: Copper stud; 3: Light source seat; 4: Light source cover; 5: Sample pool; 6: Reflective cover; 7: Optical fiber collimating mirror; 8: Adjusting rod; 9: Swallowtail guide slide block; 10: Dovetail guide rail; 11: Support
1: Objective table; 2: Copper stud; 3: Light source seat; 4: Light source cover; 5: Sample pool; 6: Reflective cover; 7: Optical fiber collimating mirror; 8: Adjusting rod; 9: Swallowtail guide slide block; 10: Dovetail guide rail; 11: Support
Fig. 4. Spectra of flour samples with different quantities
Fig. 5. Light source control module
1: Circuit board; 2: Raspberry Pi 4B; 3: Lithium battery;4: 1 kΩ pull-up resistor; 5: Halogen lamp bead;6: TIP120 Darlington transistor
1: Circuit board; 2: Raspberry Pi 4B; 3: Lithium battery;4: 1 kΩ pull-up resistor; 5: Halogen lamp bead;6: TIP120 Darlington transistor
Fig. 6. Original spectra of flour
Fig. 7. Box plot graphics depicting the outliers in original spectra
Fig. 8. Box plot graphics depicting the outliers removed
Fig. 9. Savitzky-Golay smoothing
Fig. 10. Score plot of PCA
Fig. 11. PCA of modeling set samples
Fig. 12. Decision boundary
Fig. 13. Confusion matrix of LR prediction result
Fig. 14. LR ROC curves
Fig. 15. Testing system interface
Fig. 16. Work flow chart
Fig. 17. Test results of flour moisture
|
Table 1. Moisture measurement results of flour
|
Table 2. Measurement results of DON content in flour
| ||||||||||||||||||||||||||||||||||
Table 3. PLSR prediction models after different pretreatment
|
Table 4. Detection result of samples in external verification set

Set citation alerts for the article
Please enter your email address
© Copyright 2018-2021 | Chinese Laser Press. All Rights Reserved 沪ICP备15018463号-20