
Wei Gong, Ailin Liang, Ge Han, Xin Ma, Chengzhi Xiang, "Sensitivity of on-line wavelength during retrieval of atmospheric CO2 vertical profile," Photonics Res. 3, 146 (2015)
- Photonics Research
- Vol. 3, Issue 4, 146 (2015)
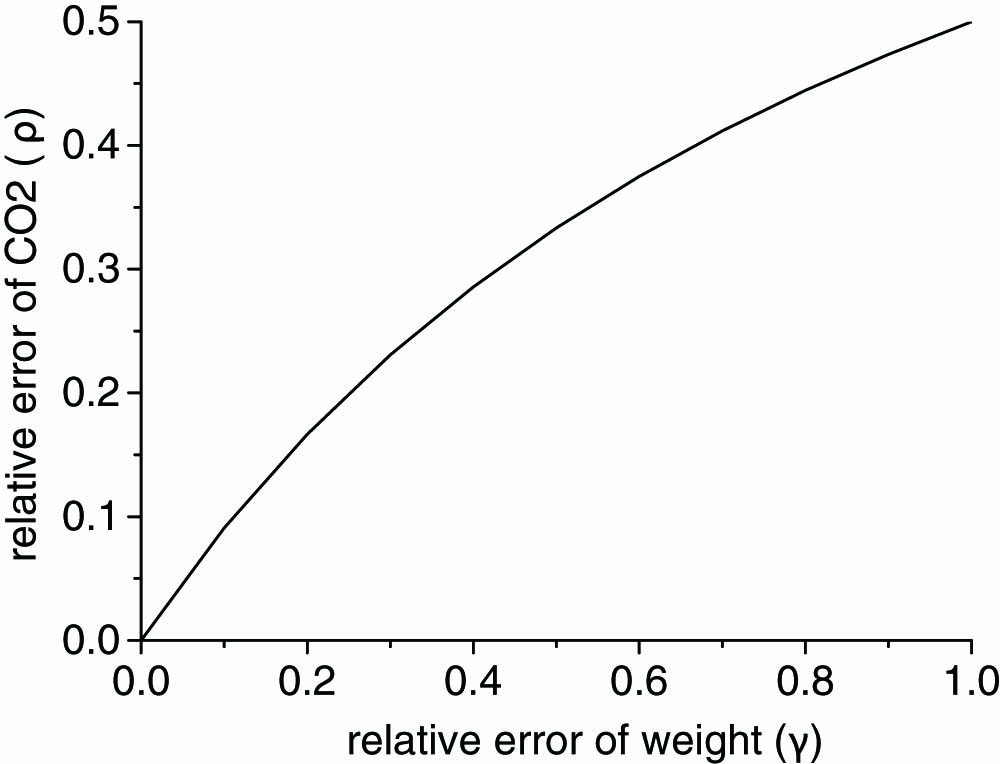
Fig. 1. Relationship of the relative error of CO 2 ρ γ
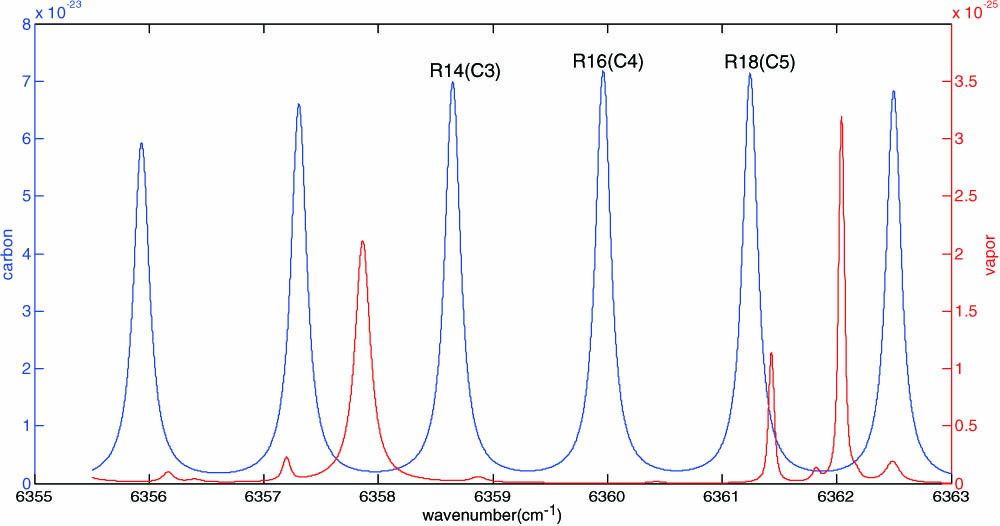
Fig. 2. Absorption cross section of CO 2 H 2 O ∼ 1.57 μm CO 2 H 2 O
Fig. 3. Weight in continuous temperature at three wave bands. The colorful area sharing the right color bar depicts the weight of different wavenumbers (horizontal axis) on continuous temperature (left axis).
Fig. 4. Relative error of weight [ γ ( T ) ]
Fig. 5. Weight in continuous pressure on multiple on-line wavenumber. The colorful area sharing the right color bar depicts the weight of different wavenumbers (horizontal axis) on continuous pressure (left axis).
Fig. 6. Relative error of weight [ γ ( P ) ]
Fig. 7. Differential molecular absorption cross section at the range of 5 km at three wave bands. The colorful area sharing the right color bar (in cm 2 cm − 1
Fig. 8. Sensitivity of atmospheric temperature and pressure on the relative error of weight with the absorption cross section at the range of wavenumbers near each absorption peak of three wave bands, R14, R16, and R18. The three figures have the same scale of vertical axes. Black curves depict the absorption cross section, sharing the left axis in cm 2 3.A . Red curves depict the relative error of weight as the pressure varies according to the analysis in Section 3.B . Blue and red curves share the right axis.


Set citation alerts for the article
Please enter your email address

© Copyright 2018-2021 | Chinese Laser Press. All Rights Reserved 沪ICP备15018463号-20