Abstract
Accurately measuring the differential molecular absorption cross section is the key to obtaining a high-precision concentration of atmospheric trace gases in a differential absorption lidar (DIAL) system. However, the CO2 absorption line is meticulous at 1.6 μm, easily translating and broadening because of the change of temperature and pressure. Hence, measuring the vertical profile of atmospheric temperature and pressure to calculate the vertical profile of the CO2 weight parameter is necessary. In general, measuring atmospheric temperature and pressure has a certain amount of uncertainty. Therefore, this study proposes the concept of a balanced on-line wavelength, where the differential molecular absorption cross section is larger and the CO2 weight parameter is insensitive to the uncertainty of atmospheric temperature and pressure. In this study, we analyzed the influence of uncertainty on the CO2 weight parameter at every preselected wavelength, as well as determined an appropriate wavelength near one of the absorption peaks. Our result shows that 1572.023 nm should be one of the appropriate balanced online wavelengths. The measurement errors of the mixing ratio of CO2 molecule in this wavelength are only 0.23% and 0.25% and are caused by 1 K temperature error and 1 hPa pressure error, respectively. This achievement of a balanced on-line wavelength will not only depress the requirement of the laser’s frequency stabilization but also the demand for measurement precision of the atmospheric temperature and pressure profile. Furthermore, this study can achieve the exact measurement of the vertical profile of atmospheric CO2 based on an independent differential absorption laser.1. INTRODUCTION
, a long-lived atmospheric trace species, is an important greenhouse gas [1–3], indicating the importance of detecting changes in atmospheric . Recently, several instruments of both passive and active remote sensing have been developed to map the global atmospheric concentration at a large scale with high precision. Differential absorption lidar (DIAL) is currently a quite promising technique to detect atmospheric concentration [4], especially in the lower atmosphere, which is close to human activities. DIAL has numerous advantages, such as nighttime coverage, availability of all latitudes, less interference by clouds and aerosol scattering, and precise column height determination [5–7]. Airborne or satellite-borne lidar measurements of atmospheric using the integrated path differential absorption lidar (IPDA) technique, a special case of the DIAL technique, are promising approaches for retrieving global column concentrations [8–10]. Active sensing of emissions over nights, days, and seasons and advanced space carbon and climate observation of planet earth missions, aimed at global column concentration measurement, had been proposed and researched by NASA and European Space Agency (ESA), respectively. Thus far, several sensitivity and simulation analyses on satellite-borne IPDA of measurements exist [5,10,11], although such instruments are still under development. By contrast, an initiative for ground-based DIAL for measurement has already been developed [12–15]. Ground-based DIAL systems are of great significance because they can provide atmospheric measurements that are range-resolved, accurate, and have high temporal resolution to complement airborne and satellite-borne measurements. However, the developers of the DIAL system for DIAL mixing ratio measurements are confronted with the very stringent requirements on measurement accuracy below 1% in volume mixing ratio. DIAL mixing ratio accuracy and precision depends on instrumental (for lidar differential absorption measurement), spectroscopic, and meteorological data accuracies and precisions.
In the process of atmospheric retrieval, the influence of temperature and pressure is not negligible. The overall influence of the temperature retrieval error on space-based measurement of atmospheric total column is less than 0.05%, which is significantly smaller than the change; this result is attributed to the 1% change in the planetary boundary layer [16]. However, the vertical profile on ground-based DIAL is more sensitive to temperature [17]. Notably, a climatological temperature profile generally produces a relative error of 0.3–1.7 ppm/K in the space-borne estimate of the atmospheric column [18]. The detection of the vertical profile of atmospheric will produce a larger error because of the uncertainty of the atmospheric temperature profile. Similarly, the uncertainty of atmospheric pressure also has a certain influence on the retrieving precision. Therefore, considering getting higher precision, we suggest that the on-line wavelength should be fixed at the balanced on-line wavelength, but not at the absorption peak [12], if the atmospheric environment varies dramatically and the measurements of temperature or pressure profiles are inaccurate when the relevant wavelength control technique is available. Selection conditions of a balanced on-line wavelength include low temperature sensitivity, low pressure sensitivity, and low interference from other molecules.
Developing an independent instrument to observe the temporal range-resolved concentration of atmospheric accurately is difficult because the biases caused by the uncertainty of temperature and pressure cannot be disregarded. Therefore, determining the balanced on-line wavelength can certainly improve the measurement accuracy of concentration. This study analyzes the effect of temperature and pressure on retrievals and calculates the balanced on-line wavelength. The two major selected wavelengths for ground-based DIAL sensing are and [13,14]. Based on the conclusion of Menzies [19], the wavelength range of 1.57 μm is not well suited for retrievals in the lower troposphere, compared to 2.0 μm. However, the study of a 1.57 μm DIAL system has developed more rapidly than a 2 μm, which has some constraints [12]. Therefore, it is especially necessary to study the sensitivity of the on-line wavelength at 1.57 μm. As our system, a part of atmospheric profiling synthetic observation system (APSOS) [20], is designed to work at , the preselection of wavelength in this study is confined to . Moreover, we focus on the retrieving process of echo signal in the 1.57 μm band to the planetary boundary layer atmospheric profile in relation to the response to a variable atmospheric environment. The presentation of the weight of temperature and pressure based on the retrieval presented in Section 2 is the innovation of this study. The influence of atmospheric temperature and pressure on the weight is the main factor for the measurement accuracy in the retrieving process of the DIAL system. Section 3 analyzes the effect of atmospheric temperature and pressure on weight and compares the retrieving error of different pre-selected on-line wavenumbers. Furthermore, the absorption cross selection is considered. Section 4 screens three segments of on-line wavelength that have lower sensitivity and larger absorption cross sections and discusses the results. Section 5 summarizes the most important findings of this study.
Sign up for Photonics Research TOC. Get the latest issue of Photonics Research delivered right to you!Sign up now
2. METHOD
The DIAL technique is a promising method for obtaining vertical profiles of atmospheric . This analysis method has an important role in the measurement of ozone, water vapor, , and other trace gases for over 30 years [10,21–24]. DIAL utilizes the absorption of detected molecules and scattering of atmosphere to obtain the damped echo signal. The efficiency of the absorption depends on the wavelength of the laser. A DIAL system transmits two laser beams of slightly different wavelengths, one at the on-line wavelength and one at the off-line wavelength, to eradicate the influence of other factors and obtain accurate information of the detected component. The lidar equation of backscatter signals at the on-line wavelength and off-line wavelength is as follows: Here, is the photon number on at range , is the photon number on at range , is the transmitted photon number, is the atmosphere backscatter coefficient, is the telescope area, is the overlap function, is the speed of light, is the laser pulse width, is the number density of detected molecules at range , is the absorption cross section of detected molecules on or , and is the atmospheric extinction coefficient at range .
As the on-line wavelength and the off-line wavelength are very close, the atmosphere backscatter coefficient () at these two wavelengths are approximately the same, as well as the atmospheric extinction coefficient (). When we analyze the signals from the same altitude, coefficient and can be viewed as the same. Thus, the number density of detected molecules at height can be computed by where and are the altitudes of the top and bottom of resolved range, respectively. The concentration of detected molecules is generally expressed by the volume proportion per atmospheric . The conversion formula between number density and concentration can be described as follows: where is and is . Based on the formula, the process of the conversion is related to the atmospheric environment including temperature and pressure. However, previous studies of the DIAL detection of atmospheric did not consider the influence of the measurement uncertainty of the atmospheric environment on the measurement accuracy. Thus, in the present study, we improved the algorithm of weight, which can be expressed as follows: Therefore, the concentration function can be rewritten as This improvement has a great advantage in retrieving atmospheric concentration and evaluating the precision of measurement. According to the function, the retrieving error of concentration caused by the uncertainty of atmospheric temperature and pressure is absolutely determined by the weight function. As shown in Fig. 1, the relationship of these two kinds of error is nonlinear, which can be described as follows: where is the relative error of concentration, is the relative error of weight at the same wavelength, , , and . and are the approximations of the full quadratic formulas.
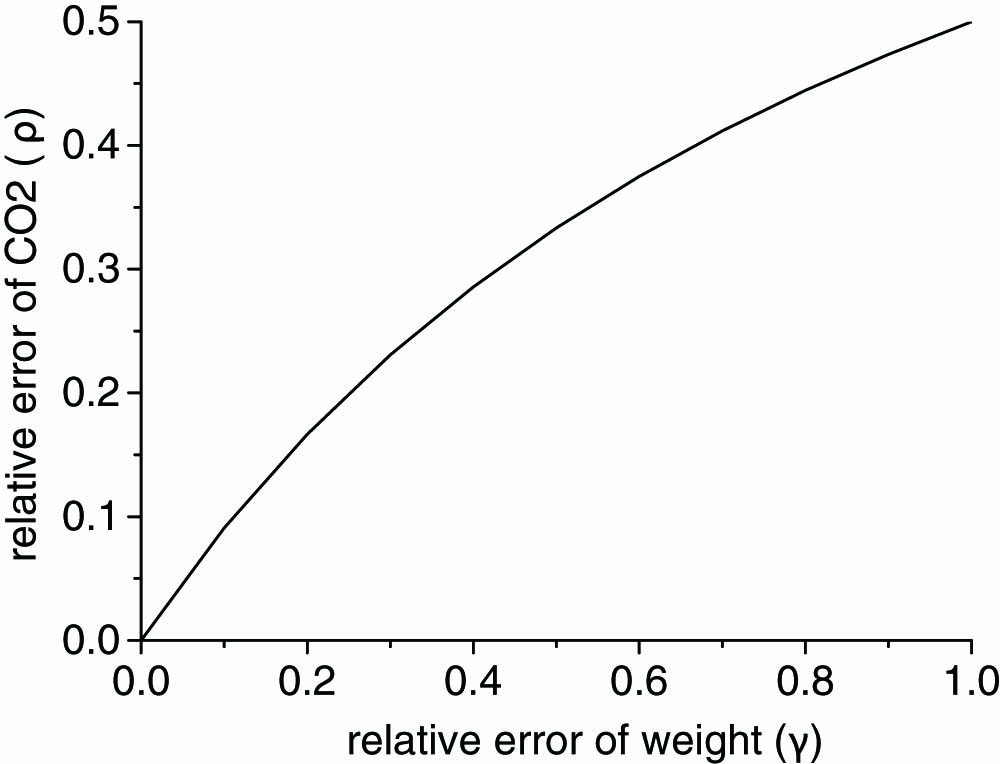
Figure 1.Relationship of the relative error of concentration () and that of weight ().
According to Eq. (6), the calculation error of concentration () will be less than 1% when the calculation error of weight () is less than 1.11%. Thus, if the concentration of atmospheric is 400 ppm, the error of weight must be controlled in approximately 1%, which can limit the error of concentration down to 4 ppm.
Overall, the improvement of the accuracy of retrieval depends on the accuracy of weight. In the equation of a weighting function , is also commonly given in pressure and temperature coordinates, which can be described as follows [25,26]: where , , is the central wavenumber, is the trial wavenumber, is line intensity at temperature , is Lorentzian half-width half-maximum (HWHM), varying with the given temperature and pressure , and is Doppler HWHM. where is the given pressure, and are the standard atmospheric pressure of 101325 Pa and temperature of 296.15 K, respectively, is the reference line HWHM, is the temperature dependence exponent of pressure-broadening coefficients, is the Boltzmann constant, is the lower energy state of the transition, h is Planck’s constant, is the molecular weight, is the central wavenumber at 0 Pa and 296 K, is the coefficient of pressure-induced shift, and is the temperature dependence coefficient of .
The relative error of weight is absolutely determined by the measurement error of atmospheric temperature and pressure. In order to develop an independent instrument system, a DIAL system without any facilities used to measure the temperature and pressure profile, to detect the atmospheric concentration, it is necessary to decrease the influence of the variation of atmospheric environment. Therefore, under the same uncertainty of atmospheric environment, decreasing the relative error of weight at the emitted wavelength as far as possible is the key to obtaining accurate results. The following section analyzes the sensitivity of temperature and pressure on retrieving weight of different wavenumbers.
3. ANALYSIS AND RESULT
Six absorption lines, including R10–R20, in the band of are preselected because the intensities of these lines are evidently higher than those of the other lines. Most spectroscopic parameters of lines are from Predoi-Cross et al. [27], who have the most updated data for at the region. However, the lower energy level (), which governs the temperature sensitivity of the absorption cross section, is from HITRAN2012 [28]. According to a previous study, water vapor is considered the most significant interference molecule with respect to absorption spectroscopy [29]. Considering the effect of water vapor absorption, Fig. 2 shows that the third (R14), fourth (R16), and fifth (R18) regions of are more appropriate for use as DIAL, owing to the higher absorption cross section of and the small effect of . Therefore, we discuss the effect on weight at the wavenumber range around these three regions, which is from 6358 to .

Figure 2.Absorption cross section of and with respect to wavenumber near . The blue line sharing the left vertical axis depicts the absorption cross section of . The red line that marks the right axis depicts the absorption cross section of .
Various approaches to obtaining the profile of the atmospheric temperature and pressure are available. The most common method is based on the 1976 U.S. Standard atmosphere model [30], which can be described by the following formulas: , . Here, , which covers the detection range of atmospheric . However, the error of the profiles of atmospheric temperature and pressure is inevitable and could be 3 K/km and 4–10 hPa/km. Other methods that can obtain relatively higher precision can be acquired by microwave radiometers or balloon sounding data. Even though the precision can be improved by a degree, the errors of atmospheric temperature and pressure still reach 1 K/km and 1 hPa/km, respectively. Thus, an appropriate balanced on-line wavelength should be used in an independent DIAL system to reduce the effect of the error on the weight as far as possible. This section then analyzes the effect on different on-line wavelengths in two parts, namely, temperature and pressure.
A. Sensitivity of Temperature on the Weight
When the pressure is constantly set to 1013.25 hPa, regardless of the on-line wavelength, the trend of the weight decreasing with increasing temperature from 256 to 296 K is similar, as shown in Fig. 3. The only difference is the gradient of decrease, which represents the sensitivity of temperature. When the measurement error of temperature is 1 K, the relative error of the retrieval is the relative variation of weight. The relative error of weight at different wave bands varies, as shown in the scatter curves in Fig. 4. The calculation is an average of a 40 K uncertainty of atmospheric temperature range up and down at the center of the current temperature. It shows that the relative error of weight is less than 0.9% on most wavenumbers, and the R14 seems to be more sensitive to the change of temperature than the other two wave bands. Besides, the most insensitive points of three wave bands slightly left deviate from the absorption peaks, and the degree of deviation gets bigger as the wavenumber of absorption peak gets bigger. When the wavenumber is far away from the most insensitive points, the relative error increases rapidly until the off-line wavenumber. Considering the influence of the uncertainty of the atmospheric temperature, to determine the insensitive balanced on-line wavelength, the average of the relative error should be smaller than 0.33% because the measurement error of the atmospheric temperature is more or less 3 K. Additionally the absorption cross section of the balanced on-line wavelength should be enough larger than the off-line wavelength that it fulfills the consideration that the optic depth of atmospheric can ensure a better signal-to-noise ratio (SNR) for the system. On screening the preselected wavenumbers, the appropriate on-line wavenumbers are notably near the 6359.654 (R14) peak, near the 6359.967 (R16) peak, and near the 6361.250 (R18) peak, the absorption cross section of which is larger than 90% of the corresponding absorption peak.
Figure 3.Weight in continuous temperature at three wave bands. The colorful area sharing the right color bar depicts the weight of different wavenumbers (horizontal axis) on continuous temperature (left axis).
Figure 4.Relative error of weight and cross section at three wave bands. The lines sharing the left axis depict the absorption cross section and the scatter curves sharing the right axis depict the relative error of weight when there is the uncertainty of atmospheric temperature. Three colors represent three wave bands, black corresponding to R14, blue corresponding to R16, and red corresponding to R18.
B. Sensitivity of Pressure on the Weight
Both the temperature and pressure vary at the detection range in a vertical measurement. The measurement of atmospheric pressure is more accurate than that of the temperature at the same range. Thus, 1 hPa is an appropriate range span to calculate the weight in the pressure profile. In this simulation, the temperature was set to 288.15 K, which is the surface temperature according to the 1976 U.S. standard atmospheric model. With the pressure continuously increasing, the weight increases, as shown in Fig. 5. Similar to the analysis of the sensitivity of temperature on the weight, Fig. 6 shows that the relative error of weight is less than 3% at most wavenumbers. It illustrates that the influence of the uncertainty of atmospheric pressure is smaller than that of atmospheric temperature on the retrieval. Similarly, the relative error of weight at the R18 wave band seems to be less than the others. But the trends of the relative weight variations are absolutely contrary to .The most insensitive point of pressure is hardly any deviation from the absorption peak at any wave bands, and the relative error decreases rapidly when the wavelength is far from the peaks until the off-line wavelength. Considering the influence of the uncertainty of atmospheric pressure, to determine the insensitive balanced on-line wavelength, the average of the relative error should be smaller than 0.33%, which is already satisfied.
Figure 5.Weight in continuous pressure on multiple on-line wavenumber. The colorful area sharing the right color bar depicts the weight of different wavenumbers (horizontal axis) on continuous pressure (left axis).
Figure 6.Relative error of weight and cross section at three wave bands. The lines sharing the left axis depict the absorption cross section and the scatter curves sharing the right axis depict the relative error of weight when there is uncertainty of atmospheric pressure. Three colors represent three wave bands, black corresponding to R14, blue corresponding to R16, and red corresponding to R18.
C. Sensitivity on Differential Molecular Absorption Cross Section
Based on the analysis of the former two parts, the influence of the uncertainty of atmospheric temperature on the weight is more than that of pressure at three wave bands as a whole. But the two kinds of relative error of weight are more or less at wavenumbers close to the absorption peaks. Compared to the others, the R18 wave band has less sensitivity to the uncertainty of atmospheric temperature and pressure. Moreover, another important consideration is the differential molecular absorption cross section. It is necessary that the differential molecular absorption cross section should be always enough larger at the detection range to ensure available retrieval. Taking the 1976 U.S. Standard atmosphere model as the average atmospheric temperature and pressure, Fig. 7 shows the differential molecular absorption cross section of three wave bands as the atmosphere environment changes at the detection range. The differential molecular absorption cross section at the wavenumbers close to absorption peaks in any altitude is more than the other wavenumbers, although it decreases as the altitude increases. Another point for consideration is that the variation near the absorption peak is fiercer than the others. In general, when the altitude is higher than 3 km, the difference around the absorption peak is less than , and the accuracy of results will be slightly lower. However, the error is unavoidable. Additionally, selecting a wavelength close to the absorption peak as the on-line wavelength has another advantage: It is beneficial for frequency stabilization [31,32]. Thus, an on-line wavelength fulfilling the consideration is top priority to be selected to obtain a perfect signal and retrieve a high accuracy result.
Figure 7.Differential molecular absorption cross section at the range of 5 km at three wave bands. The colorful area sharing the right color bar (in ) depicts the value of differential molecular absorption cross section at three wave bands (horizontal axis in ) at continuous altitude (left axis in m).
To satisfy the three previously stated requirements— namely, reducing the effects of temperature and of pressure and keeping a large differential molecular absorption cross section at the detection range—we screen for the wavenumbers from 6358 to and determine the balanced on-line wavelength. Figure 8 displays the sequence of appropriate wavenumbers of three wave bands, where the absorption cross section is more than 90% of that at their respective absorption peak, with the lower sensitivity of atmospheric temperature and pressure. The average of the absorption cross section of the wavenumbers at the R16 wave band is slightly larger than that of the others, whereas the sensitivity of the temperature and pressure at the R18 wave band is the lowest. Therefore, we suggest the balanced on-line wavelength should be selected at the most insensitive wavelength of R18 wave band. However, the comprehensive extinction coefficient notably gets larger, when there are thick clouds or hazes. The signal we receive will be weaker, which is not beneficial for retrieval. In order to get a good signal to noise ratio, it is advisable to strengthen the contrast of on-line and off-line echo signal. Regardless of the chosen option, a 3 K error of temperature and a 3 hPa error of pressure are allowable at the sequence of appropriate wavelengths. In other words, the wavenumbers shown in Fig. 8 are good choices to be the on-line wavenumbers to have less error in the retrieval. Among those regions, 1572.023 nm should be the most appropriate balanced on-line wavelengths, where the measurement of errors of the mixing ratio of the molecule is only 0.23% and 0.25% caused by 1 K temperature error and 1 hPa pressure error, respectively. The balanced on-line wavelength we suggest has a left offset from the R18 absorption peak. And the R18 absorption peak has similar sensitivity to the least sensitivity in the R16 absorption line, which has left offset from the center.
Figure 8.Sensitivity of atmospheric temperature and pressure on the relative error of weight with the absorption cross section at the range of wavenumbers near each absorption peak of three wave bands, R14, R16, and R18. The three figures have the same scale of vertical axes. Black curves depict the absorption cross section, sharing the left axis in . Blue curves depict the relative error of weight as the temperature varies according to the analysis in Section 3.A. Red curves depict the relative error of weight as the pressure varies according to the analysis in Section 3.B. Blue and red curves share the right axis.
4. CONCLUSION
This study presents an improvement to retrieve more accurate vertical profiles of concentration by decreasing the effects of both temperature and pressure uncertainty. The comprehensive influence of atmospheric temperature and pressure on retrieving the vertical profile of concentration was evaluated in this study for the first time. The key difference with previous studies is considering two processes in retrieval. One is the shift of the absorption cross section because of the variation of atmospheric temperature and pressure. The other is the conversion from the initial result in to a concentration in ppm. Most studies ignored the second influence. We improved the weight function, taking the two sources of influence into consideration. Therefore, the error of weight determines the error of retrieval caused by the atmospheric temperature and pressure. Furthermore, we proposed a concept of balanced on-line wavelength that considered the absorption cross of molecule, as well as the error resulting from the uncertainty of atmospheric temperature and pressure. The analysis on the improved weight function plays an important role in calculating the balanced on-line wavelength, which should be applied in an independent DIAL system. Meanwhile, a clear understanding of the effect of atmospheric temperature and pressure on the weight will contribute to the accuracy of the evaluation of the retrievals. Based on the analysis, we suggest the balanced on-line wavelength should be 1572.023 nm in the R18 absorption line. However, continuous research on stabilizing the on-line wavelength at of pulsed laser systems must be performed.
References
[1] C. Field, M. Van Aalst. Climate Change 2014: Impacts, Adaptation, and Vulnerability(2014).
[2] J. E. Bauer, W. J. Cai, P. A. Raymond, T. S. Bianchi, C. S. Hopkinson, P. A. Regnier. The changing carbon cycle of the coastal ocean. Nature, 504, 61-70(2013).
[3] I. Y. Fung, S. C. Doney, K. Lindsay, J. John. Evolution of carbon sinks in a changing climate. Proc. Natl. Acad. Sci. USA, 102, 11201-11206(2005).
[4] D. Bruneau, F. Gibert, P. H. Flamant, J. Pelon. Complementary study of differential absorption lidar optimization in direct and heterodyne detections. Appl. Opt., 45, 4898-4908(2006).
[5] G. R. Allan, H. Riris, J. B. Abshire, X. Sun, E. Wilson, J. F. Burris, M. A. Krainak. Laser sounder for active remote sensing measurements of CO2 concentrations. Aerospace Conference, 1-7(2008).
[6] S. Houweling, W. Hartmann, I. Aben, H. Schrijver, J. Skidmore, G.-J. Roelofs, F.-M. Breon. Evidence of systematic errors in SCIAMACHY-observed CO2 due to aerosols. Atmos. Chem. Phys., 5, 3003-3013(2005).
[7] R. J. Engelen, G. L. Stephens. Information content of infrared satellite sounding measurements with respect to CO2. J. Appl. Meteorol., 43, 373-378(2004).
[8] S. Kameyama, M. Imaki, Y. Hirano, S. Ueno, S. Kawakami, D. Sakaizawa, M. Nakajima. Performance improvement and analysis of a 1.6 μm continuous-wave modulation laser absorption spectrometer system for CO2 sensing. Appl. Opt., 50, 1560-1569(2011).
[9] J. B. Abshire, H. Riris, G. R. Allan, C. J. Weaver, J. P. Mao, X. L. Sun, W. E. Hasselbrack, S. R. Kawa, S. Biraud. Pulsed airborne lidar measurements of atmospheric CO2 column absorption. Tellus B, 62, 770-783(2010).
[10] G. Ehret, C. Kiemle, M. Wirth, A. Amediek, A. Fix, S. Houweling. Space-borne remote sensing of CO2, CH4, and N2O by integrated path differential absorption lidar: a sensitivity analysis. Appl. Phys. B, 90, 593-608(2008).
[11] S. Kawa, J. Mao, J. Abshire, G. Collatz, X. Sun, C. Weaver. Simulation studies for a space-based CO2 lidar mission. Tellus B, 62, 759-769(2010).
[12] G. J. Koch, J. Y. Beyon, F. Gibert, B. W. Barnes, S. Ismail, M. Petros, P. J. Petzar, J. Yu, E. A. Modlin, K. J. Davis. Side-line tunable laser transmitter for differential absorption lidar measurements of CO2: design and application to atmospheric measurements. Appl. Opt., 47, 944-956(2008).
[13] F. Gibert, P. H. Flamant, J. Cuesta, D. Bruneau. Vertical 2-μm heterodyne differential absorption lidar measurements of mean CO2 mixing ratio in the troposphere. J. Atmos. Ocean. Technol., 25, 1477-1497(2008).
[14] D. Sakaizawa, S. Kawakami, M. Nakajima, Y. Sawa, H. Matsueda. Ground-based demonstration of a CO2 remote sensor using a 1.57 μm differential laser absorption spectrometer with direct detection. J. Appl. Remote Sens., 4, 043548(2010).
[15] L. Fiorani, S. Santoro, S. Parracino, M. Nuvoli, C. Minopoli, A. Aiuppa. Volcanic CO2 detection with a DFM/OPA-based lidar. Opt. Lett., 40, 1034-1036(2015).
[16] J. Mao, S. R. Kawa. Sensitivity studies for space-based measurement of atmospheric total column carbon dioxide by reflected sunlight. Appl. Opt., 43, 914-927(2004).
[17] G. Han, W. Gong, H. Lin, X. Ma, Z. Xiang. Study on influences of atmospheric factors on vertical co2 profile retrieving from ground-based DIAL at 1.6 μm. IEEE Transactions on Geoscience Electronics, 53, 3221-3234(2015).
[18] E. Dufour, F.-M. Bréon. Spaceborne estimate of atmospheric CO2 column by use of the differential absorption method: error analysis. Appl. Opt., 42, 3595-3609(2003).
[19] R. T. Menzies, D. M. Tratt. Differential laser absorption spectrometry for global profiling of tropospheric carbon dioxide: selection of optimum sounding frequencies for high-precision measurements. Appl. Opt., 42, 6569-6577(2003).
[20] D. Lu, W. Pan. Atmospheric profiling synthetic observation system (APSOS). AIP Conf. Proc., 1531, 244-247(2013).
[21] E. Browell, S. Ismail, W. Grant. Differential absorption lidar (DIAL) measurements from air and space. Appl. Phys. B, 67, 399-410(1998).
[22] U. Platt, D. Perner. Direct measurements of atmospheric CH2O, HNO2, O3, NO2, and SO2 by differential optical absorption in the near UV. J. Geophys. Res., 85, 7453-7458(1980).
[23] K. Ikuta, N. Yoshikane, N. Vasa, Y. Oki, M. Maeda, M. Uchiumi, Y. Tsumura, J. Nakagawa, N. Kawada. Differential absorption lidar at 1.67 μm for remote sensing of methane leakage. Jpn. J. Appl. Phys., 38, 110(1999).
[24] P. F. Ambrico, A. Amodeo, P. Di Girolamo, N. Spinelli. Sensitivity analysis of differential absorption lidar measurements in the mid-infrared region. Appl. Opt., 39, 6847-6865(2000).
[25] B. Armstrong. Spectrum line profiles: the Voigt unction. J. Quant. Spectrosc. Radiat. Transfer, 7, 61-88(1967).
[26] E. V. Browell, S. Ismail, B. E. Grossmann. Temperature sensitivity of differential absorption lidar measurements of water vapor in the 720-nm region. Appl. Opt., 30, 1517-1524(1991).
[27] A. Predoi-Cross, A. McKellar, D. C. Benner, V. M. Devi, R. Gamache, C. Miller, R. Toth, L. Brown. Temperature dependences for air-broadened Lorentz half-width and pressure shift coefficients in the 30013 ← 00001 and 30012← 00001 bands of CO2 near 1600 nm. Can. J. Phys., 87, 517-535(2009).
[28] L. Rothman, I. Gordon, Y. Babikov, A. Barbe, D. Chris Benner, P. Bernath, M. Birk, L. Bizzocchi, V. Boudon, L. Brown. The HITRAN2012 molecular spectroscopic database. J. Quant. Spectrosc. Radiat. Transfer, 130, 4-50(2013).
[29] A. Amediek, A. Fix, M. Wirth, G. Ehret. Development of an OPO system at 1.57 μm for integrated path DIAL measurement of atmospheric carbon dioxide. Appl. Phys. B, 92, 295-302(2008).
[30] A. J. Krueger, R. A. Minzner. A mid-latitude ozone model for the 1976 US Standard Atmosphere. J. Geophys. Res., 81, 4477-4481(1976).
[31] K. Numata, J. R. Chen, S. T. Wu, J. B. Abshire, M. A. Krainak. Frequency stabilization of distributed-feedback laser diodes at 1572 nm for lidar measurements of atmospheric carbon dioxide. Appl. Opt., 50, 1047-1056(2011).
[32] G. Wertheim, M. Butler, K. West, D. Buchanan. Determination of the Gaussian and Lorentzian content of experimental line shapes. Rev. Sci. Instrum., 45, 1369-1371(1974).


