• Photonics Research
  • Vol. 12, Issue 1, 260 (2024)
Sergey Alyshev1, Alexander Vakhrushev1, Aleksandr Khegai1, Elena Firstova1, Konstantin Riumkin1, Mikhail Melkumov1, Lyudmila Iskhakova1, Andrey Umnikov2, and Sergei Firstov1、*
Author Affiliations
  • 1Prokhorov General Physics Institute of the Russian Academy of Sciences, Dianov Fiber Optics Research Center, 119333 Moscow, Russia
  • 2Devyatykh Institute of Chemistry of High-Purity Substances of the Russian Academy of Sciences, 603951 Nizhny Novgorod, Russia
  • show less
    DOI: 10.1364/PRJ.498782 Cite this Article Set citation alerts
    Sergey Alyshev, Alexander Vakhrushev, Aleksandr Khegai, Elena Firstova, Konstantin Riumkin, Mikhail Melkumov, Lyudmila Iskhakova, Andrey Umnikov, Sergei Firstov. Impact of doping profiles on the formation of laser-active centers in bismuth-doped GeO2–SiO2 glass fibers[J]. Photonics Research, 2024, 12(1): 260 Copy Citation Text show less
    (a) Design of the fiber preforms: RIP formed by variation of GeO2 content. (b) Typical view of the surface of the polished slab (central region with a higher GeO2 content is brighter than the peripheral one; black color corresponds to the silica glass cladding) cut out from the preform. (c) Typical RIP of the fabricated preforms (solid line) and fibers (dashed line), fundamental mode intensity profile calculated using the fiber RIP (dashed–dotted line). (d) Bi ions concentration (symbols) and relative BACs concentration (solid line) as a function of radial coordinate from the center of the preforms (Samples A, B, and C).
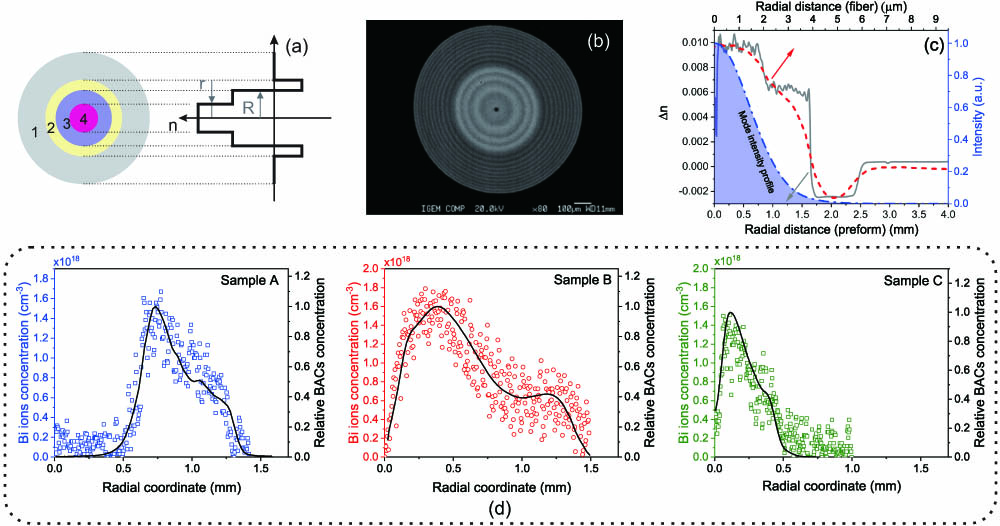
    Fig. 1. (a) Design of the fiber preforms: RIP formed by variation of GeO2 content. (b) Typical view of the surface of the polished slab (central region with a higher GeO2 content is brighter than the peripheral one; black color corresponds to the silica glass cladding) cut out from the preform. (c) Typical RIP of the fabricated preforms (solid line) and fibers (dashed line), fundamental mode intensity profile calculated using the fiber RIP (dashed–dotted line). (d) Bi ions concentration (symbols) and relative BACs concentration (solid line) as a function of radial coordinate from the center of the preforms (Samples A, B, and C).
    Absorption and luminescence properties of the studied BDFs. (a) Small-signal absorption spectra. (b) Schematic energy-level diagram of BACs-Si indicating the absorption (arrow up lines), emission (arrow down solid line), and non-radiative (dotted and wavy lines) transitions. (c) Luminescence spectra of Sample B under various excitation wavelengths.
    Fig. 2. Absorption and luminescence properties of the studied BDFs. (a) Small-signal absorption spectra. (b) Schematic energy-level diagram of BACs-Si indicating the absorption (arrow up lines), emission (arrow down solid line), and non-radiative (dotted and wavy lines) transitions. (c) Luminescence spectra of Sample B under various excitation wavelengths.
    Power dependences of the optical loss at 1310 nm (balls) and luminescence at 1430 nm (squares) of the studied samples. Inset: residuals indicating difference between experimental and calculation data.
    Fig. 3. Power dependences of the optical loss at 1310 nm (balls) and luminescence at 1430 nm (squares) of the studied samples. Inset: residuals indicating difference between experimental and calculation data.
    (a) Detailed view of the absorption (σa) and emission (σe) cross-sections spectra of BACs (solid lines) and their Gaussian decomposition (dashed and dotted lines), correspondingly. (b) Conversion factor of the total Bi content into the active centers of the BDFs versus the radial coordinate.
    Fig. 4. (a) Detailed view of the absorption (σa) and emission (σe) cross-sections spectra of BACs (solid lines) and their Gaussian decomposition (dashed and dotted lines), correspondingly. (b) Conversion factor of the total Bi content into the active centers of the BDFs versus the radial coordinate.
    (a) Small-signal gain spectra of a 30 m long BDF (Sample C) core-pumped at λp=1310 nm (gray band) for various input powers. Red band indicates the selected region used for achieving lasing. (b) Typical output emission spectra of the CW Bi-doped fiber laser operating at λL∼1461 nm and detailed view of the laser lines measured with a resolution bandwidth of 0.07 nm (inset) with different output powers at λp=1310 nm.
    Fig. 5. (a) Small-signal gain spectra of a 30 m long BDF (Sample C) core-pumped at λp=1310  nm (gray band) for various input powers. Red band indicates the selected region used for achieving lasing. (b) Typical output emission spectra of the CW Bi-doped fiber laser operating at λL1461  nm and detailed view of the laser lines measured with a resolution bandwidth of 0.07 nm (inset) with different output powers at λp=1310  nm.
    (a) Output power of the lasers based on Sample C as a function of the absorbed pump power at λp=1310 nm and 1340 nm. (b)–(d) Dependences of slope efficiency (η), output power (PL), pump power threshold (Pth), and unabsorbed pump power (Punabs) of the lasers based on Samples A, B, C on the length of the active fibers, correspondingly.
    Fig. 6. (a) Output power of the lasers based on Sample C as a function of the absorbed pump power at λp=1310  nm and 1340 nm. (b)–(d) Dependences of slope efficiency (η), output power (PL), pump power threshold (Pth), and unabsorbed pump power (Punabs) of the lasers based on Samples A, B, C on the length of the active fibers, correspondingly.
    Experimental setup for the measurement of the gain in BDFs.
    Fig. 7. Experimental setup for the measurement of the gain in BDFs.
    Schematic of Bi-doped fiber laser experiments. OSA is an optical spectrum analyzer; LPF is a 1400 nm long-pass filter; HR FBG is a highly reflective fiber Bragg grating.
    Fig. 8. Schematic of Bi-doped fiber laser experiments. OSA is an optical spectrum analyzer; LPF is a 1400 nm long-pass filter; HR FBG is a highly reflective fiber Bragg grating.
    SampleParameters for CalculationaCalculated Parameters
    L, mσa/σe, pm2bPsat, mWN0, 1017  cm3Conversion Factor, %
    τ, μsLossLuminescence
    A6405310.049/0.466.51.510
    B640300.30.081/0.785.75.235
    C640400.50.063/0.606.34.030
    B6400.20.068/0.646.63.810
    Table 1. Parameters Used for Calculation and the Calculated Ones of the Investigated Samples
    Sergey Alyshev, Alexander Vakhrushev, Aleksandr Khegai, Elena Firstova, Konstantin Riumkin, Mikhail Melkumov, Lyudmila Iskhakova, Andrey Umnikov, Sergei Firstov. Impact of doping profiles on the formation of laser-active centers in bismuth-doped GeO2–SiO2 glass fibers[J]. Photonics Research, 2024, 12(1): 260
    Download Citation