Sergey Alyshev1, Alexander Vakhrushev1, Aleksandr Khegai1, Elena Firstova1..., Konstantin Riumkin1, Mikhail Melkumov1, Lyudmila Iskhakova1, Andrey Umnikov2 and Sergei Firstov1,*|Show fewer author(s)
Sergey Alyshev, Alexander Vakhrushev, Aleksandr Khegai, Elena Firstova, Konstantin Riumkin, Mikhail Melkumov, Lyudmila Iskhakova, Andrey Umnikov, Sergei Firstov, "Impact of doping profiles on the formation of laser-active centers in bismuth-doped GeO2–SiO2 glass fibers," Photonics Res. 12, 260 (2024)
Copy Citation Text
【AIGC One Sentence Reading】:This paper explores how doping profiles affect bismuth-doped GeO2-SiO2 glass fibers in forming laser-active centers, finding that conversion efficiency varies with Bi and Ge distribution, achieving a record slope efficiency of 80% in a CW laser at 1.46 μm.
【AIGC Short Abstract】:This study explores the effects of doping profiles on bismuth-doped GeO2-SiO2 glass fibers for broadband amplification in telecom bands. Using the modified chemical vapor deposition technique, we fabricated a series of fibers and examined the impact of doping concentrations on the formation of bismuth active centers. Our findings reveal a low Bi-to-BACs conversion efficiency in high-Bi regions. However, we achieved a record slope efficiency of 80% in a continuous-wave laser at 1.46 μm using a confined doping profile fiber, indicating improved performance with optimized doping.
Note: This section is automatically generated by AI . The website and platform operators shall not be liable for any commercial or legal consequences arising from your use of AI generated content on this website. Please be aware of this.
Abstract
Multi-wavelength-band transmission technology based on the exploitation of the extended spectral region is considered as a potential approach to increase the transmission capacity in the deployed fiber-optic communication infrastructure. The development of optical amplifiers operating in the O-, E-, S-, and U-telecom bands is an extremely important challenge for the successful implementation of this technology. Bismuth-doped fibers are of increasing interest as gain materials, which can be used to provide broadband amplification in the mentioned telecom bands. This is due to the ability of Bi ions incorporated into glass network to form bismuth active centers (BACs) with specific optical properties, which are primarily determined by the glass modifiers. In this work, the impact of the doping profiles of both Ge atoms as glass modifiers and Bi ions on the BACs formation is studied using a series of bismuth-doped fibers fabricated by the modified chemical vapor deposition (MCVD) technique. The Bi-to-BACs conversion efficiency in various spatial regions of the studied samples is presented. It is turned out that for high-Bi concentration regions, the conversion efficiency is very low (less than 10%). In addition, the relationship of the conversion efficiency to the distribution of Bi ions and/or Ge atoms is discussed. Finally, a continuous-wave laser at 1.46 μm with a record slope efficiency of 80% is demonstrated using a Bi-doped fiber with confined doping profile, where the Bi-to-BACs conversion efficiency is 35%. This paper provides new information which might help to facilitate understanding of the features of Bi-doped fibers and their potentially achievable characteristics.
1. INTRODUCTION
The modern world has grown reliant on telecommunication technologies driving ever increasing demand for data traffic due to, in particular, widespread sharing of full HD and lately 4K video, video calling, rapid advent of 5G mobile networks, artificial intelligence, cloud services, and many other factors [1,2]. However, the capacity of a fiber as well as any other communication channel is limited. According to the current forecast, during the next 20–25 years the data traffic can increase more than 100 times, i.e., the maximum information carrying capacity of an individual fiber will be passed soon, leading to what is commonly referred to as “capacity crunch” [3,4]. Since there is no reason to expect that the trend will significantly change in the foreseeable future, an intensive search for potential ways to overcome these limitations has been started. Nowadays, multi-band transmission technology [5] is considered as one of the promising techniques that can actually increase the transmission capacity by exploiting the new spectral ranges in addition to the C- and L-telecom bands. In this regard, the entire low-loss spectrum of the single-mode silica-based fibers from 1260 nm up to 1620 nm (O-, E-, S-, C-, L-, and U-bands) can be fully engaged in order to increase the performance of already deployed optical fiber systems without the need for new fiber infrastructure roll-out. The latest conference on optical fiber communication (OFC 2023) showed that this direction is being actively pursued. In particular, a significant progress regarding the development of the first coherent dense wavelength division multiplexing (DWDM) system up to 135 km using 9.6 THz bandwidth in the O-telecom band was realized using a bismuth-doped fiber amplifier (BDFA) [6]. It should be noted that it was by no means the first case of application of BDFAs for data transmission in the unconventional spectral ranges. Some scientific groups are intensively developing, testing, and upgrading BDFAs for various telecommunication systems operating in the O-, E-, S-bands, as reported in a number of published papers [7–15].
The choice of Bi-doped fibers (BDFs) as the basis for the development of optical amplifiers for the O-, E-, and S- bands is due to their unique characteristics, especially a broad gain bandwidth, and low pump power requirements, which are obvious advantages over other types of fiber amplifiers, such as Pr-doped fiber amplifier, Raman fiber amplifier, and Tm-doped fiber amplifier [16–20]. Interest in BDFs as active media for lasers and amplifiers increased after the production of this type of fiber with a gain band beyond 1300 nm in 2008 [21]. The optimization of the technological process of fabrication along with the chemical composition of BDFs made it possible to obtain improved gain media allowing one to develop the efficient amplifiers operating in the wavelength region of 1260–1750 nm [22]. Nowadays, BDFAs demonstrate promising gain and noise figure characteristics in all the telecom bands using either the core-pumping or cladding-pumping configurations [18,23,24].
The exceptional properties of Bi-doped fibers originate from bismuth active centers (BACs) which, in contrast to Bi ions, possess an energy level diagram, where the near-IR transitions are possible [25]. Depending on the chemical composition of the host glass, in particular, on the presence of the glass forming elements, such as Al, P, Si, and Ge [26–28], various types of BACs with different gain bands, which together cover practically the entire wavelength range from 1150 to 1775 nm, can be formed. The process of the BACs formation and the underlying physico-chemical reactions during fiber manufacturing is the least understood part of the Bi-doped fiber fabrication technology. A detailed study of these mechanisms might make it possible to understand how all content of Bi can be converted into BACs, while now only a small fraction of Bi is involved in the formation of BACs. The Bi-to-BACs conversion efficiency might be dependent on a number of factors, including variation of glass composition over the core diameter, even for the case of uniform distribution of Bi concentration. Thus, by varying content of Al, Ge, and P, we can simultaneously influence the refractive index profile (RIP) and the resulting BACs concentration profile to produce, for example, confine-doped fibers, which can be promising for the creation of optical devices with enhanced output characteristics.
Sign up for Photonics Research TOC. Get the latest issue of Photonics Research delivered right to you!Sign up now
In this paper, we focus on the fabrication of a series of Bi-doped glass core fibers with various Bi and Ge doping profiles and perform a comprehensive analysis of their optical and laser properties. The obtained data provide a framework for analyzing the effect of doping profiles on the characteristics of the laser gain medium, including the conversion efficiency of Bi ions into BACs, their radial distribution, and relationship with content. We conclude with a discussion on potential “smart” management of BACs radial distribution by controlling the Ge doping profile.
2. EXPERIMENT
A. Samples
We fabricated a series of preforms using the modified chemical vapor deposition (MCVD) technique with all-gas-phase deposition technology. Heraeus F-300 silica tubes () were used as the substrate [layer 1 in Fig. 1(a)] and jacketing tubes. The preform fabrication process included a number of stages. Initially, the process of the deposition of silica glass doped with fluorine on the inner surface of the silica tube (layer 2) was performed using and as starting reagents. Once the depressed cladding deposited, at the next stage of the manufacturing process Bi-doped glass layers [3 and 4 in Fig. 1(a)] were fabricated. The technical process started with the upstream deposition of germanosilicate glass soot layers of the required composition at a temperature of . Doping of the glass layers with Bi ions was provided during the process of downstream sintering of the soot layers at a temperature of 2000°C in presence of a gas flowing through the substrate tube. In this case, Bi deposition on the surface of porous glass was carried out through the high-temperature reaction of decomposition in the heating zone provided by an oxygen–hydrogen burner. Using the described procedure, we deposited and sintered several Bi-doped layers with a low content, then followed by several Bi-doped layers with a higher content. In our experiments, flow was maintained the same during the entire technical process. These glass layers formed a double-step-like (the central region with the higher Ge content and peripheral region with the lower Ge content) structure of the core. Finally, the tube with the deposed glass layers was collapsed into a monolithic glass rod (a fiber preform) at a temperature of 2100°C with addition of to reduce OH contamination. Before the final sealing of the tube, the preform was etched in gas flow to reduce the central dip due to evaporation. It should be noted that the fabrication process of all the preforms was the same, except for the Bi addition procedure where we purposefully varied the doping profile: (i) uniform distribution of Bi content in both central and peripheral regions (Sample B); (ii) and (iii) uniform distribution of Bi content in only the peripheral (Sample A) and only the central (Sample C) region, correspondingly. In addition, we studied Sample as an analogue of Sample B with an increased concentration of Bi ions. For qualitative analysis of the BAC and Bi content distributions we prepared 1 mm thick polished slabs, which were cut out from the fabricated preforms perpendicular to their axis. In addition, the single-mode BDFs with a cutoff wavelength of 1.2–1.3 μm and an outer diameter of 125 μm were drawn using the conventional technique at a temperature of 1900°C and a speed of 10 m/min.
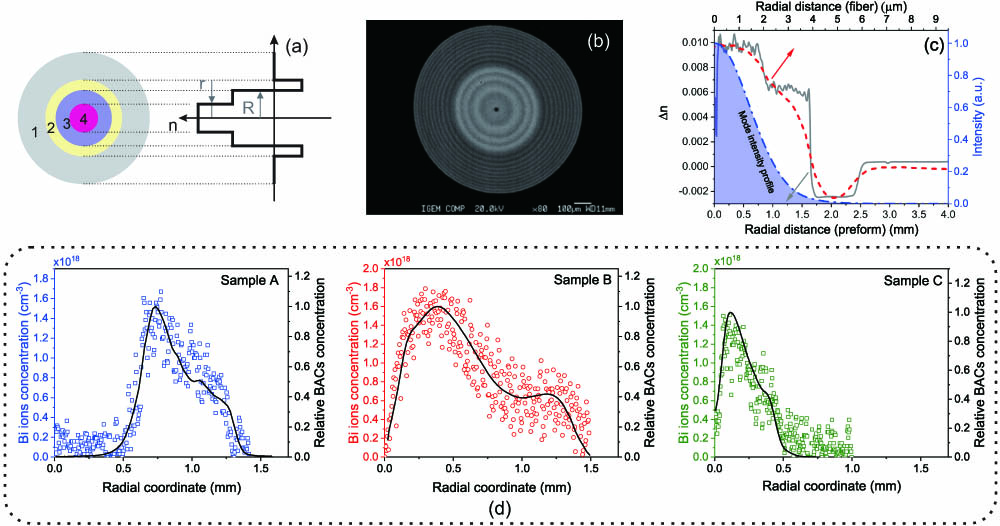
Figure 1.(a) Design of the fiber preforms: RIP formed by variation of content. (b) Typical view of the surface of the polished slab (central region with a higher content is brighter than the peripheral one; black color corresponds to the silica glass cladding) cut out from the preform. (c) Typical RIP of the fabricated preforms (solid line) and fibers (dashed line), fundamental mode intensity profile calculated using the fiber RIP (dashed–dotted line). (d) Bi ions concentration (symbols) and relative BACs concentration (solid line) as a function of radial coordinate from the center of the preforms (Samples A, B, and C).
The radial distribution of bismuth ions over the core of the studied fiber preforms with a spatial resolution of 5 μm was determined by wavelength-dispersive X-ray microanalysis (WDMA) using a JEOL JXA 8200 microprobe spectrometer (probe current 100 nA, accelerating voltage 20 kV). Before the measurement, a carbon conductive coating was deposited on the samples. The bismuth concentration was measured using the line and a high-aperture pentaerythritol (H) crystal; the accumulation time was 60 s for characteristic X-ray line intensity, and 30 s for the background intensity on both sides from the peak. The detection limit of the used equipment was 58 ppm (parts per million; ).
The radial distribution of relative BACs content in the investigated fiber preforms was measured by means of the technique based on luminescence analysis as described in detail in Ref. [29]. According to our assumptions, the intensity of BACs luminescence peaked at a wavelength of 1430 nm excited by laser radiation corresponds to the relative concentration of BACs associated with Si. During the experiments, the BACs in a diameter core of studied samples were uniformly excited by collimated radiation from a laser diode at a wavelength of 798 nm. The radial distribution of the luminescence intensity of the sample was obtained by sequentially point-by-point scanning (with a step of 100 μm) across the sample core, measuring the spectra of emission collected by a 50-μm-core () fiber positioned by a ThorLabs NanoMax 300 stage. The emission spectra of the sample were measured with an Ocean Optics NIRQuest spectrometer. To eliminate the scattered excitation light, an interference long-pass filter with an edge wavelength of 1000 nm was used.
C. Absorption and Luminescence Spectroscopy
The small-signal absorption spectra were measured with the cut back technique using a halogen lamp (Mikropack DH-2000) and an optical spectrum analyzer (OSA; Agilent 86140B). In addition, we determined the unsaturable loss at the pump wavelength used in the gain and laser experiments. For this purpose, we measured the dependences of the absorption on the launched power radiation provided by a home-made Bi-doped fiber laser operating at the wavelength of 1.31 μm with an output power of up to 1 W. Hereinafter, the residual loss level, which is achieved after the saturation of the active absorption at a certain input power, we shall call as unsaturable loss.
The measurements of the luminescence spectra of BDFs were performed by the experimental setup described in detail in Ref. [30]. In this case, the GTWave fiber design was used, which ensures the launch of pump light into the core and detection of luminescence propagating through the cladding of the active fiber. The active fiber was stripped of a protective polymer coating to achieve a light-guidance in the fiber cladding to collect stronger luminescence signal. Depending on the experiment, we used laser diodes, a Fianium SC450 supercontinuum source, and a Bi-doped fiber laser operating at 1.31 μm as excitation sources. The luminescence signal from the sample, which propagated in the opposite direction to the pump light, was detected using an HP 70950B optical spectrum analyzer. The measurements were performed at various levels of the excitation power in the range of 0.1–1 W. The input power was monitored by an Ophir NOVA II power meter equipped with a 3A-FS detector. The resulting luminescence spectra were corrected on the transmission function of the experimental setup.
D. Gain and Laser Characteristics
The schematic layout for the measurement of the gain spectra in Bi-doped fibers is shown in Appendix A. The length of the active fiber was several tens of meters. In all the cases, the small-signal gain coefficient per unit length at wavelength was calculated as using the measured input and output powers of a narrow signal line.
The classic all-fiber laser configuration presented in Appendix A was utilized for lasing. The experiments were started with an excessive length of the active fiber, and then the test fiber was gradually shortened to find the optimal fiber length for maximum efficiency. All tests were carried out at room temperature; the lasers operated in normal air conditions without any cooling.
3. RESULTS AND DISCUSSION
A. Design and Characterization of Bi-Doped Fibers
Figure 1(a) shows a typical design of the RIPs of the fabricated preforms consisting of central and peripheral regions made of glass having different chemical composition, in particular, various content. Each region included a series of glass layers, which can be clearly observed in the photography of the surface of a polished slab cut out from one of the preforms [Fig. 1(b)]. As a result, we obtained samples with a double-step-like structure of RIP, where is greater in the central part and lower in the peripheral one. A typical RIP of the preform, measured by a Photon Kinetics PK 2600 preform analyzer, is presented in Fig. 1(c).
As can be observed, is in the central layers that is almost 1.5 times higher than that of the outer layers adjacent to silica glass. When comparing the RIP of the preform with that of the single-mode fiber measured by the S14 profiler [Fig. 1(c)], it can be seen that, quite expectedly, the profile became smoother due to the diffusion process of Ge atoms, which potentially can also affect the BACs formation and their distribution. It should be noted that the cross-sectional area of the central region is 3 times smaller than the peripheral one since . However, this does not reflect directly the contribution of each region to the studied optical characteristics of the samples since the BACs distribution and its overlap with the fundamental mode should also be taken into account [see Fig. 1(c)]. Figure 1(d) illustrates the results of measurements of the Bi ions concentration () in the samples. The peak Bi concentration in Samples A, B, and C was close to . Despite the fact that during the manufacturing process the doping with bismuth was equal through all the deposited layers, the resulting distribution of Bi ions in the central and peripheral regions for Sample B was not uniform, which may be due to evaporation of Bi ions or their diffusion from the inner layers to the outer layers during the manufacturing process. A similar non-uniformity was also observed in Samples A and C where Bi-doping is localized either in the central or peripheral region. For the sake of comparison, we also illustrate the distributions of relative BACs concentration, which are indicated by the solid lines in Fig. 1(d). It turned out that the BACs distribution was consistent with that of total Bi concentration. Further, we assumed that this distribution of BACs remained unchanged in the fibers drawn from the preforms, which was used to determine the concentration of BACs.
Figure 2(a) shows the absorption spectra of the studied BDFs measured in a spectral range of 700–1650 nm. The absorption spectra of all the samples had a similar structure involving the distinctive bands peaked at 1400 and 830 nm corresponding to the and transitions, respectively, which are demonstrated in the schematic energy-level diagram of BACs-Si in Fig. 2(b). As one would expect, in our case, greater absorption (in a range of 0.6–1.1 dB/m) takes place for the samples with the Bi-doped central region (Samples B and C), where there is a significant overlap of the BACs concentration profile with the fundamental mode intensity profile [Fig. 1(c)]. As can be seen, the band at a wavelength of 830 nm has a complex structure: a number of the individual narrow bands can be distinguished, that can be explained by the existence of different BAC-Si subtypes [31]. It should be noted that the band with a maximum at a wavelength of 1400 nm with an asymmetric line shape has a wider and less structured spectrum than the short-wavelength band. Inhomogeneous effects with respect to the luminescent properties can manifest themselves in shifting the spectral peak position of emission at around 1400 nm depending on the excitation wavelength falling into the 800 nm absorption band of BACs-Si. This took place in our case, when we observed the smooth change of the maximum of luminescence to the longer-wavelength region from 1400 to 1440 nm when the excitation wavelength was shifted from 790 to 850 nm [Fig. 2(c)]. It is worth noting that a similar broadband luminescence can also be detected under excitation at 1310 nm, as shown in Fig. 2(c).
Figure 2.Absorption and luminescence properties of the studied BDFs. (a) Small-signal absorption spectra. (b) Schematic energy-level diagram of BACs-Si indicating the absorption (arrow up lines), emission (arrow down solid line), and non-radiative (dotted and wavy lines) transitions. (c) Luminescence spectra of Sample B under various excitation wavelengths.
It is worth noting that Bi is a polyvalent element capable of forming different types of optically active and non-active centers, which can coexist in the same glass matrix (for example, Ref. [32]). It is well known that at least two types of Bi-related centers are inherent to BDFs: BACs and centers responsible for the unsaturable loss. However, the unsaturable losses can be explained by not only the formation of bismuth-related centers, but also by the presence of long tails of some absorption bands associated with glass point defects, scattering due to glass inhomogeneity, and imperfection of the fiber structure. It is for this reason that it is difficult to estimate the contribution of bismuth to the unsaturable losses. Nevertheless, one can definitely state that the absolute concentration of BACs-Si has to differ from the total Bi concentration. One of the possible ways to obtain the data on the absolute BACs concentration is based on the luminescence and absorption saturation spectroscopy. For this purpose, we measured the characteristic power dependences of the absorption and luminescence of the BDFs (Fig. 3). In each case, one can note a decrease of the BACs absorption with the increasing used power due to the saturation of the absorption transition. The level of unsaturable loss of all the studied fibers was quite low: about 4% for Sample A, and less than 2% for Samples B and C, which corresponds to the best bismuth-doped fibers. The behavior of the luminescence intensity of the samples versus the input pump power was also quite typical: at first rapid growth followed by slowdown and saturation.
Figure 3.Power dependences of the optical loss at 1310 nm (balls) and luminescence at 1430 nm (squares) of the studied samples. Inset: residuals indicating difference between experimental and calculation data.
To find the absolute concentration of the BACs, we performed numerical calculation fitting a numerical model to the obtained power dependences of the absorption and luminescence. This model was built taking into account the following rather straightforward considerations. At first, the distribution of intensity of the pump radiation launched into the fiber core is non-uniform in both directions: in the longitudinal direction caused by the attenuation and in the transverse direction due to the guiding mechanism of the fiber. This can be represented by the following expressions: , where is the effective beam area, and is the envelope (intensity profile) of the mode [Fig. 1(c)]. By the integration over the transverse coordinate at any point , we determine the optical power at this point, neglecting as in all further considerations the dependence of any physical quantity on the azimuthal angle. The interaction of the light with the medium containing the BACs leads to the buildup of the population inversion with a certain distribution caused by the non-uniformity of . At steady state, this can be expressed in terms of the saturation power , as follows: where ; is the emission and absorption cross section, correspondingly; is the lifetime in the metastable state; is the photon energy at the signal wavelength; is the population number density of the metastable state, and is the total number density (the concentration) of BACs, where is the peak concentration and is the doping profile normalized to 1.
Second, an excited active medium produces a luminescent signal with the total power, which is proportional to the total number of active centers in the metastable state: where is a proportionality constant, which, among other things, takes into account the peculiarities of a specific experimental setup used to acquire the luminescent signal, and is the length of the fiber.
Third, the depletion of the pump radiation propagating along the BDF is caused by two main mechanisms, namely BACs absorption and background (unsaturable) loss. Thus, the propagation of the pump power radiation along can be described by the following differential equation: where is the BACs absorption coefficient for pump power at the coordinate of ; denotes the small-signal active absorption; and is the background (unsaturable) loss. The power dependent overlap factor is expressed as follows:
Note, when the power is very small (small-signal regime) the inversion of the medium is negligible, that is, ; hence, and . Equation (3) simplifies to the common form: leading to the well-known Beer–Lambert–Bouguer law: . In any case, the total loss in the fiber, as usual, is given by the equation
Figure 4.(a) Detailed view of the absorption () and emission () cross-sections spectra of BACs (solid lines) and their Gaussian decomposition (dashed and dotted lines), correspondingly. (b) Conversion factor of the total Bi content into the active centers of the BDFs versus the radial coordinate.
Using the total Bi concentration presented in Fig. 1(d), we estimated the conversion factor, i.e., the percentage of total Bi ions number that participated in the formation of BACs determined as . The obtained data in terms of the conversion factor against the radial coordinate are plotted in Fig. 4(b). It is seen that the conversion factor in the Bi-doped central region (Samples B and C) reached about 35%, while that of the Bi-doped peripheral region (Sample A) was noticeably lower, near 10%. Interestingly, in contrast to Sample A, Sample B demonstrated a high conversion factor () even in the Bi-doped peripheral region. In our opinion, it is explained by the fact that Sample B had lower total Bi ions concentration in peripheral layers in comparison with Sample A at the similar Ge content. Thus, we might suggest that the conversion factor is concentration-dependent: it reduces with the increasing of the Bi ions content. However, it should be noted that, at the same concentration of bismuth (Samples B and C), the Bi-to-BACs conversion factor in the central part maintained a high value for the studied samples. Therefore, it is reasonable to assume that the conversion factor depends not only on the total bismuth concentration, but also on the Ge content, or more likely on their ratio. To confirm this assumption, we additionally fabricated in a similar way a sample designated as Sample , with a doubled Bi ions concentration in both regions of the core compared to Sample B as above mentioned [Fig. 4(b)]. As expected, the conversion factor dramatically decreased down to 10% even in the central region, as shown in Fig. 4(b). According to the conversion factor values for different regions in the same sample, one can conclude that, besides the Bi ions content, the concentration distribution plays an important role in the observable changes of the conversion factor. In particular, as follows from the obtained results, there are limiting Bi concentrations for a certain content, above which the conversion factor starts to decrease significantly. Earlier, it was found that the fraction of the total number of Bi ions involved in the formation of BAC can significantly grow upon addition of compared to the glass based on silica without [34]. This is also consistent with a general concept, according to which the addition of Ge in silica glass facilitates the formation of the oxygen-deficiency centers [35], which may play an essential role in the formation of BACs [24].
C. Amplification of Bi-Doped Fibers and CW Lasers
Figure 5(a) shows the small-signal gain spectra of Sample C, which is typical of the studied BDFs, for various pump powers at . As it is usually the case, the spectral shape of gain G strongly depended on the pump power at a low pump level, then in the high-pump regime (about 1 W of pump power) the medium saturated and the dependence almost disappeared. At that pump level the population of the metastable level reached its maximum achievable level throughout the entire fiber allowing us to use the gain-per-meter value for characterization of the active medium, which was around 0.25 dB/m in the case of Sample C. In the case of no pumping, a typical absorption band can be observed, similar to that shown in Fig. 2(a). A small peak at 1380 nm corresponds to the OH-group absorption. This peak turns into a dip in the gain spectra.
Figure 5.(a) Small-signal gain spectra of a 30 m long BDF (Sample C) core-pumped at (gray band) for various input powers. Red band indicates the selected region used for achieving lasing. (b) Typical output emission spectra of the CW Bi-doped fiber laser operating at and detailed view of the laser lines measured with a resolution bandwidth of 0.07 nm (inset) with different output powers at .
For Samples A and B, the gain-per-meter amounted to and 0.45 dB/m, correspondingly. It should be noted that in the short-wavelength region , one can observe a broad band that is practically independent of the pump power. Taking into account the shape of this band, it can be assumed that, from the point of view of efficiency, a longer pump wavelength is more preferable. This assumption is confirmed by the results of the experiments on lasing, which are discussed below.
The laser experiments showed that all the investigated samples can successfully be used for the development of CW laser sources. Typical laser output spectra and the detailed view of laser lines at different laser powers () are presented in Fig. 5(b) and the inset, correspondingly. The emission spectra of the lasers consisted of a narrow line at 1461.5 nm and a broadband amplified spontaneous emission ranging between 1350 and 1550 nm. With the increase of the output , the following changes can be observed: (i) the laser linewidth became wider; (ii) the spectral peak position of the laser line shifted to the longer wavelengths.
Generally, the developed lasers demonstrated stable CW operation with a high slope efficiency (). The characteristic dependences of the output power of the laser based on Sample C on the absorbed pump power are depicted in Fig. 6(a). One can see that grows linearly with the increasing absorbed pump power . The maximum slope efficiency of 80% with respect to the absorbed pump power () at 1340 nm was achieved. When the pump wavelength () at 1310 nm was used, the slope efficiency of all the lasers decreased. This result agrees with the data on gain characteristics of BDFs presented above, where an unknown absorption band was found [Fig. 5(a)]. The detailed behavior of the output parameters, such as , , pump power threshold (), and unabsorbed pump power () of the lasers core-pumped at 1310 nm versus the length of studied BDFs is presented in Figs. 6(b)–6(d). The lasers based on Samples B and C started to provide generation at the length of active fiber of 20–30 m, while, in the case of Sample A, at least twice of that length was needed to achieve lasing. All the lasers had and relatively low , which varied in the range of 20–100 mW and grew linearly with the increasing length of BDF. Furthermore, the investigated lasers were capable of operating without a significant reduction (in the range of ) in the slope efficiency for all used lengths of active fiber, that is, the slope efficiency practically reached saturation at the length of 50–60 m. At the same time, the maximum of 600–700 mW was predictably obtained at the minimum , using appropriate active fiber length, as can be seen comparing the evolution of and [Figs. 6(b)–6(d)].
Figure 6.(a) Output power of the lasers based on Sample C as a function of the absorbed pump power at and 1340 nm. (b)–(d) Dependences of slope efficiency (), output power (), pump power threshold (), and unabsorbed pump power () of the lasers based on Samples A, B, C on the length of the active fibers, correspondingly.
As it was presented above, the maximum slope efficiency was achieved for Sample C, where the active ions concentrated around the center of the core that ensures an enhanced pump–dopant interaction due to the fundamental mode profile overlap with the dopant distribution. Confined doping profile for this type of active fiber helps efficiently utilize pump energy, minimizing the presence of underpumped regions along the fiber. In a similar way, one can explain a decrease in the slope efficiency for Sample A with annular Bi doping profile: in this case, a large proportion of the active region of the fiber interacts with the low-intensity part of the mode profile distribution resulting in a lower population inversion, i.e., a lower gain, for the same amount of total pump power. Aside from that, in addition, one might suspect that detrimental for optical properties clustering effects take place; especially near the core–cladding interface depleted in germanium ions caused by the diffusion processes but containing a sufficient number of Bi ions. However, we suggest that this effect is negligible because of low intensity of the fundamental mode in the core–cladding boundary region.
It is interesting to note that the laser performance of the active fibers was comparable despite the fact that they were characterized by different conversion factors. Thus, 60%–90% of non-active Bi ions did not significantly affect the gain and laser characteristics of low- glass fibers, that is, their contribution to the formation of Bi-related centers responsible for the unsaturable loss is negligible. However, the situation can be quite opposite for other types of bismuth-doped fibers, especially with the core made of phospho- or aluminosilicate glass exhibiting a higher level of unsaturable loss at the comparative Bi ion concentration. Nevertheless, this question is beyond the scope of this paper and belongs to future research.
4. CONCLUSIONS
In summary, we fabricated and performed a comprehensive investigation of a series of single-mode bismuth-doped fibers with a non-conventional (for this type of active fiber) refractive index profile that was designed by varying content and having different transverse distribution of Bi ions. By the WDMA, total Bi ions concentration over the cross section of the fiber preforms was measured. The peak concentration of Bi ions in all the samples was equal to . Using the luminescence and absorption saturation spectroscopy and numerical calculation, we determined the concentration of BACs in the fabricated samples, which was found to be . For the first time, the conversion efficiency of Bi ions into the BACs across the core radius was calculated. It was found that the conversion efficiency (conversion factor) varies from 10% to 35% in dependence on the selected region of the core and Bi ions content. Analyzing the obtained data, one can conclude that besides the Bi ions content, the Ge presence and its distribution in glass matrix play an essential role in the observed conversion factor. In particular, it follows from the obtained results that there are threshold Bi concentrations for a certain content, above which the conversion factor begins to decrease significantly. In addition, the laser with a record slope efficiency of 80% at a wavelength of 1.46 μm with respect to the absorbed pump power at 1.34 μm was developed using confined Bi-dopant distribution in the active fiber core. The obtained results allow one to consider such gain media as a promising candidate for the development of optical amplifiers enabling a new-generation technological platform for modern optical communication networks.
Acknowledgment
Acknowledgment. The authors are grateful to A. N. Abramov and N. N. Vechkanov for assistance in the fabrication of the single-mode fibers.
APPENDIX A: EXPERIMENTAL SETUPS
The experimental setup for the measurement of the gain in BDFs is shown in Fig. 7. A Fianium SC450 supercontinuum source was used as a source of probe signal from broadband radiation of which a narrow spectral line with a width of 5 nm was cut off by an acousto-optic tunable filter (AOTF) by Crystal Technology, Inc. AODS 20160-8. The input signal power was about in the entire spectral region. As a pump source, a home-built tunable-wavelength Bi-doped fiber laser operating at 1.31 μm with output power was used. The signal/pump radiation was launched into the core of the active fiber by means of an optical wideband coupler. We used the lock-in amplifier synchronous detection technique to eliminate the optical noise induced by amplified spontaneous emission. The pump power was chosen to provide the maximum achievable population inversion along the fiber at the certain pump wavelength. The optical isolator was placed to prevent pump backreflection. The signal passed through a wideband coupler to the monochromator and then was detected by the InGaAs photodiode in the range of 1000–1700 nm. The control unit processed the signals from the chopper and photodiodes and controlled the monochromator and the AOTF wavelength.
Figure 7.Experimental setup for the measurement of the gain in BDFs.
Figure 8.Schematic of Bi-doped fiber laser experiments. OSA is an optical spectrum analyzer; LPF is a 1400 nm long-pass filter; HR FBG is a highly reflective fiber Bragg grating.
[1] A. Ferrari, A. Napoli, N. Costa. Multi-band optical systems to enable ultra-high speed transmissions. European Conference on Lasers and Electro-Optics, ci_2_3(2019).
[4] A. Chralyvy. Plenary paper: the coming capacity crunch. 35th European Conference on Optical Communication(2009).
[5] J. K. Fischer, M. Cantono, V. Curri. Maximizing the capacity of installed optical fiber infrastructure via wideband transmission. 20th International Conference on Transparent Optical Networks (ICTON), 1-4(2018).
[6] D. J. Elson, Y. Wakayama, V. Mikhailov. 9.6-THz single fibre amplifier O-band coherent DWDM transmission. Optical Fiber Communications Conference and Exhibition (OFC), 1-3(2023).
[8] F. Maes, M. Sharma, L. Wang. High power BDF/EDF hybrid amplifier providing 27 dB gain over 90 nm in the E+ S band. Optical Fiber Communication Conference, Th4C-8(2022).
[9] L. Wang, Y. Fung, M. Sharma. Bandwidth-dependent gain deviation in E+S band bismuth doped fiber amplifier under automatic gain control. Optical Fiber Communication Conference, Th3C-3(2023).
[13] N. Wang, J. Li, D. Zhang. Real-time 50 Gb/s upstream transmission in TDM-PON with class E1 power budget using Ge/Si avalanche photodiode and bismuth-doped fiber as preamplifier. Optical Fiber Communications Conference and Exhibition (OFC), 1-3(2023).
[14] Y. Wang, A. Halder, D. Richardson. A highly temperature-insensitive Bi-doped fiber amplifier in the E+S-band with 20 dB flat gain from 1435–1475 nm. Optical Fiber Communication Conference, Th3C-2(2023).
Sergey Alyshev, Alexander Vakhrushev, Aleksandr Khegai, Elena Firstova, Konstantin Riumkin, Mikhail Melkumov, Lyudmila Iskhakova, Andrey Umnikov, Sergei Firstov, "Impact of doping profiles on the formation of laser-active centers in bismuth-doped GeO2–SiO2 glass fibers," Photonics Res. 12, 260 (2024)
 AI Video Guide
  AI Picture Guide
 AI One Sentence