• Acta Optica Sinica
  • Vol. 40, Issue 18, 1811002 (2020)
Jinguang Lü1、**, Baixuan Zhao1、2, Jingqiu Liang1、*, Weibiao Wang1, Yuxin Qin1、2, and Jin Tao1
Author Affiliations
  • 1State Key Laboratory of Applied Optics, Changchun Institute of Optics, Fine Mechanics and Physics, Chinese Academy of Sciences, Changchun, Jilin 130033, China
  • 2University of Chinese Academy of Sciences, Beijing 100049, China
  • show less
    DOI: 10.3788/AOS202040.1811002 Cite this Article Set citation alerts
    Jinguang Lü, Baixuan Zhao, Jingqiu Liang, Weibiao Wang, Yuxin Qin, Jin Tao. Modeling and Experiment of Image Field Modulated Fourier Transform Imaging Spectrometer[J]. Acta Optica Sinica, 2020, 40(18): 1811002 Copy Citation Text show less
    Principle diagram of image field modulated Fourier transform imaging spectrometer
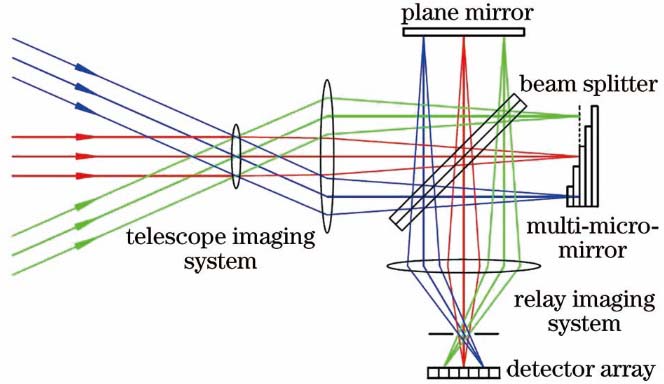
    Fig. 1. Principle diagram of image field modulated Fourier transform imaging spectrometer
    Data structure of image field modulated Fourier transform imaging spectrometer
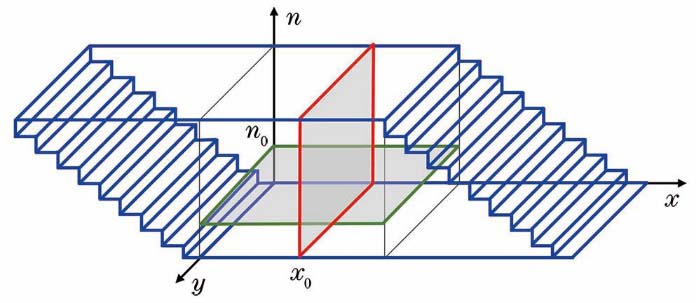
    Fig. 2. Data structure of image field modulated Fourier transform imaging spectrometer
    Illustration of optical path modulation to image field by multi-micro-mirror
    Fig. 3. Illustration of optical path modulation to image field by multi-micro-mirror
    Light intensity distribution of target scene
    Fig. 4. Light intensity distribution of target scene
    Intensity distribution of interference image
    Fig. 5. Intensity distribution of interference image
    Data processing and results of interference image. (a) Panoramic image by image splicing; (b) interferogram by fringe splicing; (c) recovered spectral image; (d) recovered spectral curves of line object sampling point
    Fig. 6. Data processing and results of interference image. (a) Panoramic image by image splicing; (b) interferogram by fringe splicing; (c) recovered spectral image; (d) recovered spectral curves of line object sampling point
    Prototype of image field modulated Fourier transform imaging spectrometer
    Fig. 7. Prototype of image field modulated Fourier transform imaging spectrometer
    Interference image data cube
    Fig. 8. Interference image data cube
    Image shearing line by edge detection and interpolation fitting
    Fig. 9. Image shearing line by edge detection and interpolation fitting
    Image after feature registration splicing
    Fig. 10. Image after feature registration splicing
    Spliced image after frequency domain filtering
    Fig. 11. Spliced image after frequency domain filtering
    Interferogram after interference fringe splicing
    Fig. 12. Interferogram after interference fringe splicing
    Data processing of interferogram sequence. (a) Extraction; (b) baseline correction; (c) addressing apodization
    Fig. 13. Data processing of interferogram sequence. (a) Extraction; (b) baseline correction; (c) addressing apodization
    Data processing of recovered spectra. (a) Non-uniform sampling correction; (b) spectral demodulation
    Fig. 14. Data processing of recovered spectra. (a) Non-uniform sampling correction; (b) spectral demodulation
    Jinguang Lü, Baixuan Zhao, Jingqiu Liang, Weibiao Wang, Yuxin Qin, Jin Tao. Modeling and Experiment of Image Field Modulated Fourier Transform Imaging Spectrometer[J]. Acta Optica Sinica, 2020, 40(18): 1811002
    Download Citation