• Photonics Research
  • Vol. 11, Issue 1, 35 (2023)
Qiang Wu1, Lei Gao1、4、*, Yulong Cao1, Stefan Wabnitz2、3, Zhenghu Chang1, Ai Liu1, Jingsheng Huang1, Ligang Huang1, and Tao Zhu1、5、*
Author Affiliations
  • 1Key Laboratory of Optoelectronic Technology & Systems (Ministry of Education), Chongqing University, Chongqing 400044, China
  • 2Dipartimento di Ingegneria dell’Informazione, Elettronica e Telecomunicazioni, Sapienza Università di Roma, 00184 Roma, Italy
  • 3CNR-INO, Istituto Nazionale di Ottica, 80078 Pozzuoli (NA), Italy
  • 4e-mail: gaolei@cqu.edu.cn
  • 5e-mail: zhutao@cqu.edu.cn
  • show less
    DOI: 10.1364/PRJ.471291 Cite this Article Set citation alerts
    Qiang Wu, Lei Gao, Yulong Cao, Stefan Wabnitz, Zhenghu Chang, Ai Liu, Jingsheng Huang, Ligang Huang, Tao Zhu. Single-shot measurement of wavelength-resolved state of polarization dynamics in ultrafast lasers using dispersed division-of-amplitude[J]. Photonics Research, 2023, 11(1): 35 Copy Citation Text show less
    Principle of DFT and dispersed division-of-amplitude method. An ultrafast pulse is time-stretched, and the optical spectrum is mapped into the temporal domain, under the far-field approximation imparted by propagation in a dispersive medium. Next, the dispersed signal is split into four channels, and after calibration of each individual wavelength, a wavelength-resolved system matrix is built.
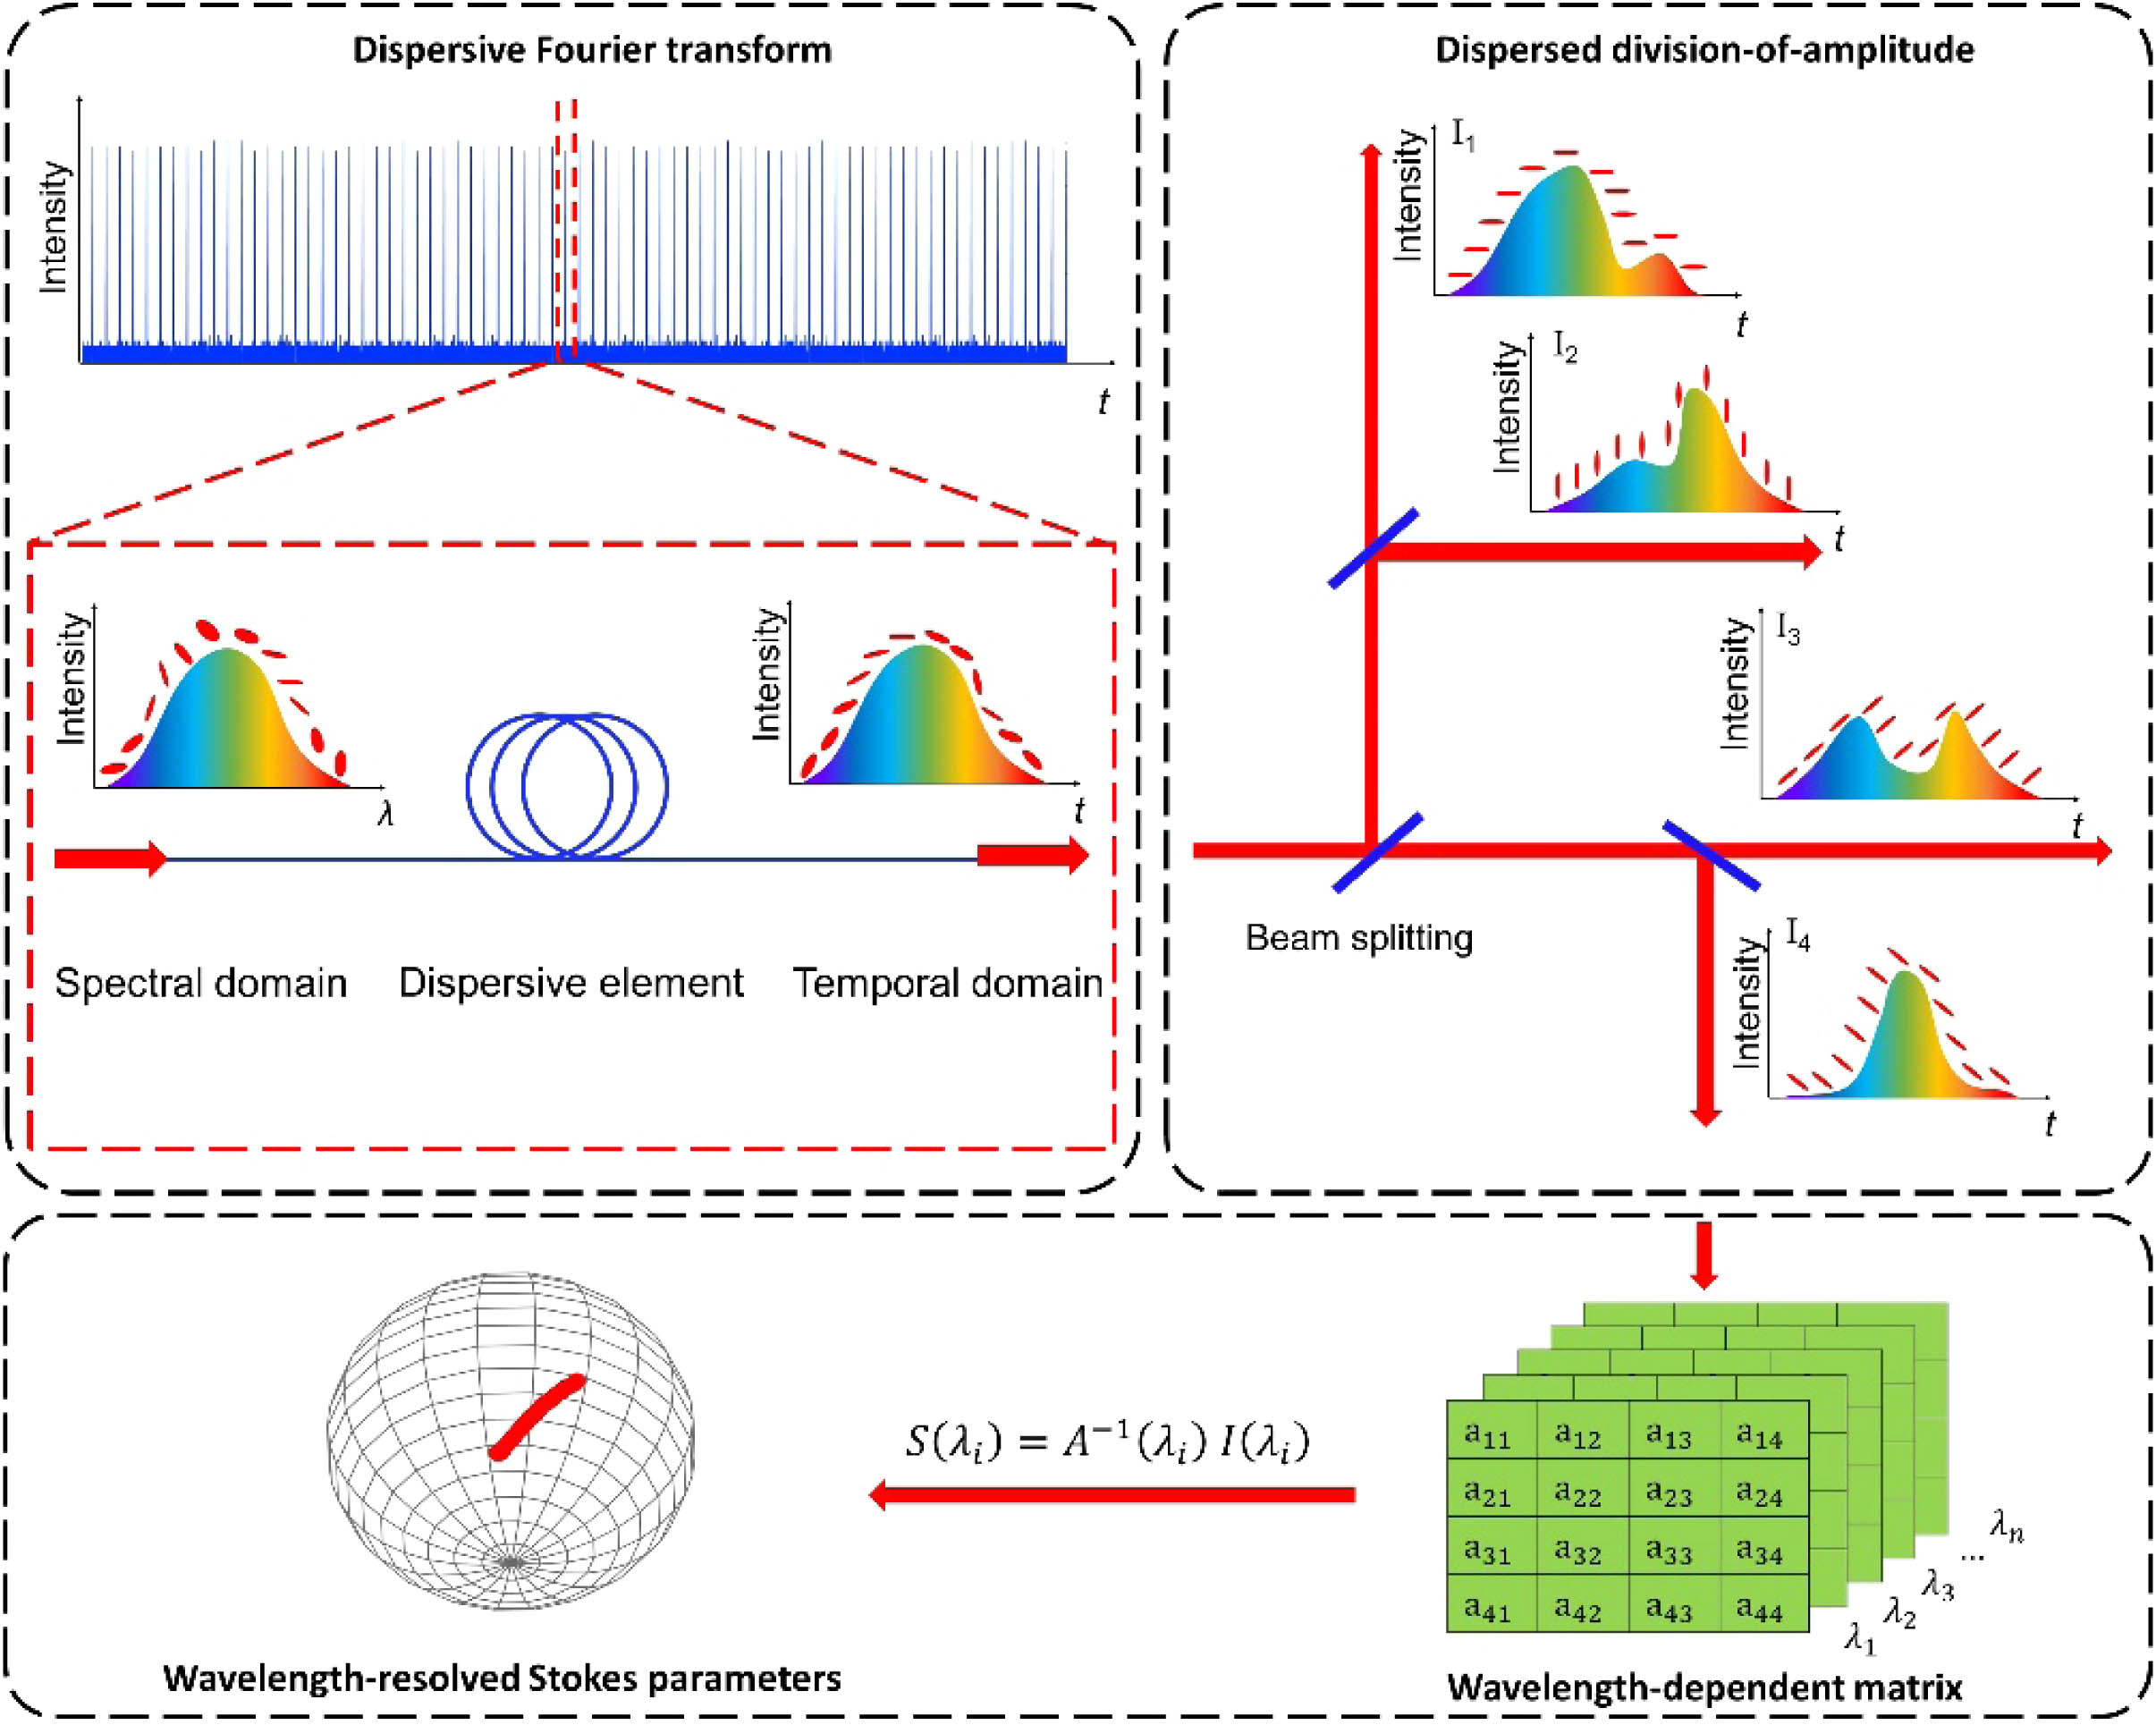
    Fig. 1. Principle of DFT and dispersed division-of-amplitude method. An ultrafast pulse is time-stretched, and the optical spectrum is mapped into the temporal domain, under the far-field approximation imparted by propagation in a dispersive medium. Next, the dispersed signal is split into four channels, and after calibration of each individual wavelength, a wavelength-resolved system matrix is built.
    Schematic of the fiber laser cavity and measurement system containing a 980 nm pump laser (Pump), erbium-doped fiber (EDF), wavelength division multiplexer (WDM), saturable absorber (SA), polarization-independent isolator (ISO), polarization controller (PC), optical couplers (OC1, OC2), dispersion compensating fiber (DCF), erbium-doped fiber amplifier (EDFA), optical spectrum analyzer (OSA), collimators (C0–C4), beam splitters (BS1–BS3), analyzers (P1–P4), quarter-wave plate (Q1), polarization state generator (PSG), photodetectors (PD1–PD4), and digital oscilloscope. Blue lines denote laser beams propagating in fiber, and red lines indicate free-space laser propagation. Black lines are electrical signals.
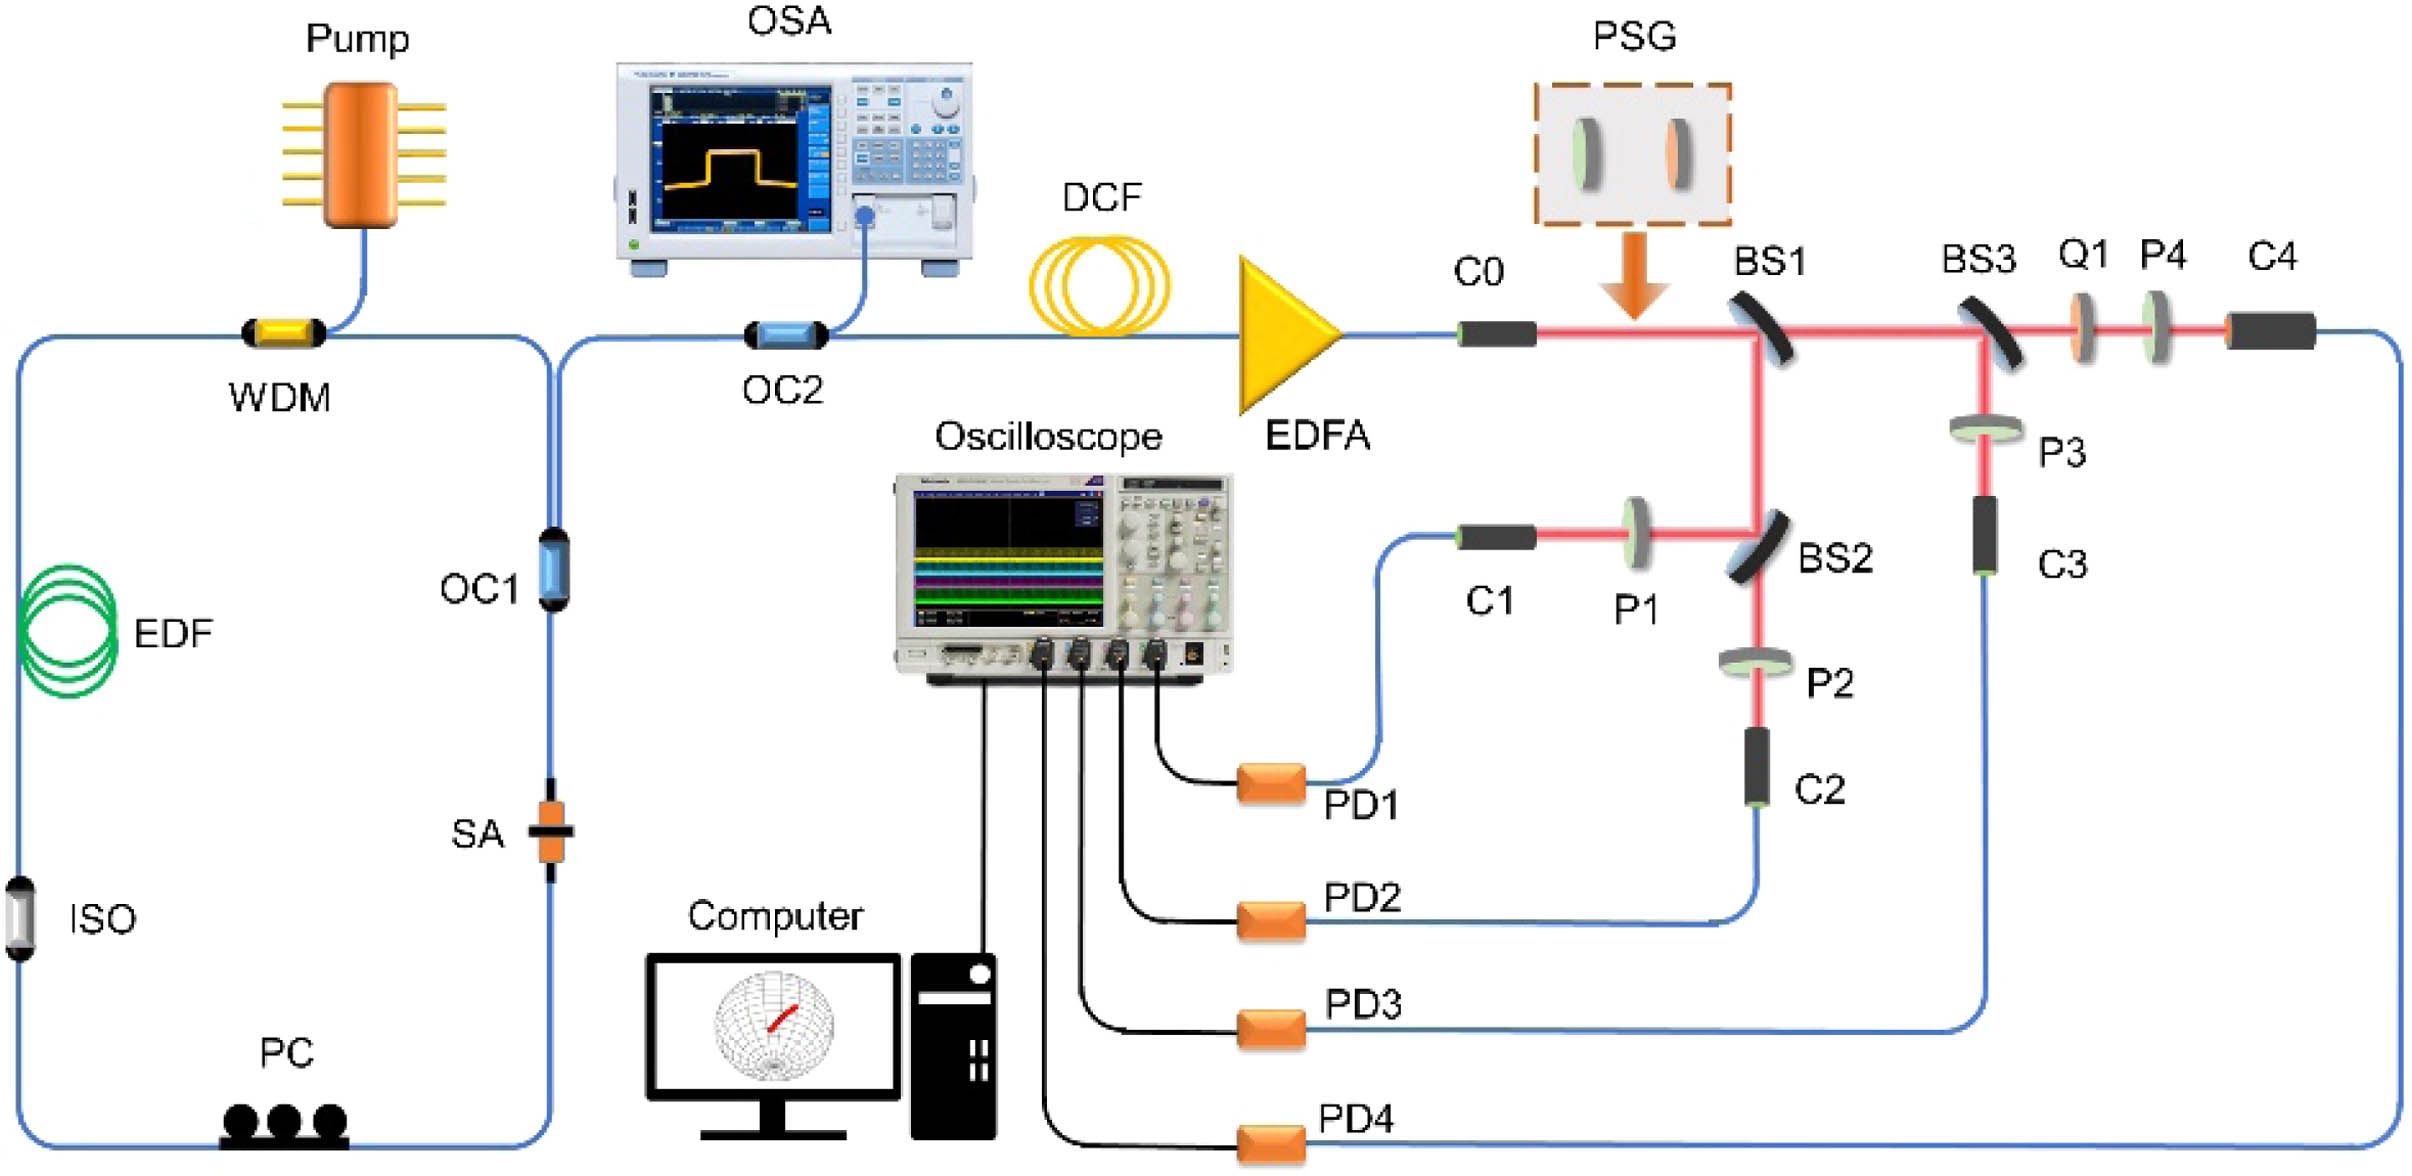
    Fig. 2. Schematic of the fiber laser cavity and measurement system containing a 980 nm pump laser (Pump), erbium-doped fiber (EDF), wavelength division multiplexer (WDM), saturable absorber (SA), polarization-independent isolator (ISO), polarization controller (PC), optical couplers (OC1, OC2), dispersion compensating fiber (DCF), erbium-doped fiber amplifier (EDFA), optical spectrum analyzer (OSA), collimators (C0–C4), beam splitters (BS1–BS3), analyzers (P1–P4), quarter-wave plate (Q1), polarization state generator (PSG), photodetectors (PD1–PD4), and digital oscilloscope. Blue lines denote laser beams propagating in fiber, and red lines indicate free-space laser propagation. Black lines are electrical signals.
    Calibration of division-of-amplitude. (a)–(c) Theoretical value (black solid curve) and experimental points (colored circles) of S1, S2, and S3 Stokes parameters at 1550 nm. The polarizer is set at an angle of 90°, and the rotation angle of the quarter-wave plate is 180°. As a result, the three Stokes parameters periodically evolve with the angle θ, with periods of 90°, 90°, and 180°, respectively. (d), (e) Deviation and mean error of Stokes parameters at wavelengths of 1560, 1566, and 1572 nm, respectively: these values cover almost entirely the spectral bandwidth that we used. The mean deviation is less than 0.07 for all the three wavelengths. (f) Theoretical points (red circles) and measured SOPs (blue circles) on the Poincaré sphere. The trace forms a figure-of-eight pattern moving from the north pole to the south pole, as determined by the combination of polarizer angle and quarter-wave plate.
    Fig. 3. Calibration of division-of-amplitude. (a)–(c) Theoretical value (black solid curve) and experimental points (colored circles) of S1, S2, and S3 Stokes parameters at 1550 nm. The polarizer is set at an angle of 90°, and the rotation angle of the quarter-wave plate is 180°. As a result, the three Stokes parameters periodically evolve with the angle θ, with periods of 90°, 90°, and 180°, respectively. (d), (e) Deviation and mean error of Stokes parameters at wavelengths of 1560, 1566, and 1572 nm, respectively: these values cover almost entirely the spectral bandwidth that we used. The mean deviation is less than 0.07 for all the three wavelengths. (f) Theoretical points (red circles) and measured SOPs (blue circles) on the Poincaré sphere. The trace forms a figure-of-eight pattern moving from the north pole to the south pole, as determined by the combination of polarizer angle and quarter-wave plate.
    Characteristics of DS. (a) Optical spectra measured by OSA for pump powers ranging from 28 to 32 mW. The corresponding bandwidth increases from 12 to 14 nm. For comparison, retrieved temporal waveform obtained by DFT for the pump power of 28 mW is shown (red line). (b) Autocorrelation trace of a DS under 28 mW and the corresponding Gaussian fitting curve. The full width at half maximum (FWHM) of pulse duration is about 30 ps. (c) SOPs measured by a commercial polarization analyzer, when the broad spectrum under 28 mW is filtered linearly from 1561 to 1573 nm by a tunable filter, denoted by black arrow. (d) Phase diagram based on the spherical orientation angle θ and ellipticity angle ψ calculated from SOPs under 28 mW in (c), denoted by black arrow. The spherical orientation angle θ variation is about 0.25 rad, and the ellipticity angle ψ variation is nearly 0.3 rad.
    Fig. 4. Characteristics of DS. (a) Optical spectra measured by OSA for pump powers ranging from 28 to 32 mW. The corresponding bandwidth increases from 12 to 14 nm. For comparison, retrieved temporal waveform obtained by DFT for the pump power of 28 mW is shown (red line). (b) Autocorrelation trace of a DS under 28 mW and the corresponding Gaussian fitting curve. The full width at half maximum (FWHM) of pulse duration is about 30 ps. (c) SOPs measured by a commercial polarization analyzer, when the broad spectrum under 28 mW is filtered linearly from 1561 to 1573 nm by a tunable filter, denoted by black arrow. (d) Phase diagram based on the spherical orientation angle θ and ellipticity angle ψ calculated from SOPs under 28 mW in (c), denoted by black arrow. The spherical orientation angle θ variation is about 0.25 rad, and the ellipticity angle ψ variation is nearly 0.3 rad.
    (a)–(d) Single-shot spectra of four channels (CH1–CH4) associated with the DS, when the pump power is 28 mW. Regions I, II, and III in the build-up process correspond to spectrum broadening, spectrum oscillation, and stable mode-locking, respectively, and are marked by semitransparent white stripes. The associated numbers of round trips are 1100th–1400th, 4800th–5100th, and 9000th–9300th, respectively. (e)–(g) Reconstructed wavelength-resolved SOPs for three selected regions of DSs. SOPs evolve from a random distribution towards concentrated and ordered island. (h) Reconstructed wavelength-resolved SOPs in region III for pump powers of 28, 29, and 31 mW.
    Fig. 5. (a)–(d) Single-shot spectra of four channels (CH1–CH4) associated with the DS, when the pump power is 28 mW. Regions I, II, and III in the build-up process correspond to spectrum broadening, spectrum oscillation, and stable mode-locking, respectively, and are marked by semitransparent white stripes. The associated numbers of round trips are 1100th–1400th, 4800th–5100th, and 9000th–9300th, respectively. (e)–(g) Reconstructed wavelength-resolved SOPs for three selected regions of DSs. SOPs evolve from a random distribution towards concentrated and ordered island. (h) Reconstructed wavelength-resolved SOPs in region III for pump powers of 28, 29, and 31 mW.
    (a)–(l) Stokes parameters evolution versus number of round trips for wavelengths at 1561, 1564, 1567, and 1570 nm, respectively, in regions I, II, and III of Fig. 5. (m)–(o) Mean value and standard deviation of Stokes parameters for the four selected wavelengths in these three regions. Legend is in the bottom left.
    Fig. 6. (a)–(l) Stokes parameters evolution versus number of round trips for wavelengths at 1561, 1564, 1567, and 1570 nm, respectively, in regions I, II, and III of Fig. 5. (m)–(o) Mean value and standard deviation of Stokes parameters for the four selected wavelengths in these three regions. Legend is in the bottom left.
    Qiang Wu, Lei Gao, Yulong Cao, Stefan Wabnitz, Zhenghu Chang, Ai Liu, Jingsheng Huang, Ligang Huang, Tao Zhu. Single-shot measurement of wavelength-resolved state of polarization dynamics in ultrafast lasers using dispersed division-of-amplitude[J]. Photonics Research, 2023, 11(1): 35
    Download Citation