
Qiang Wu, Lei Gao, Yulong Cao, Stefan Wabnitz, Zhenghu Chang, Ai Liu, Jingsheng Huang, Ligang Huang, Tao Zhu, "Single-shot measurement of wavelength-resolved state of polarization dynamics in ultrafast lasers using dispersed division-of-amplitude," Photonics Res. 11, 35 (2023)
- Photonics Research
- Vol. 11, Issue 1, 35 (2023)
Abstract
1. INTRODUCTION
Characterizing the state of polarization (SOP) of lasers plays an essential role in various fields, ranging from fundamental science to applications. At variance with single frequency lasers, ultrafast lasers have a much wider spectrum, due to mode-locking into ultrashort pulse trains. Recently, it has been found that ultrafast lasers may generate complex wavelength-dependent polarization structures [1–13]. Therefore, the precise characterization of the wavelength-resolved SOP of ultrafast lasers is of great fundamental and technological significance. For example, polarization-dependent regimes and complex polarization evolution processes, including polarization-locked [1,2] and polarization rotation phenomena [3–5], have been widely reported in laser cavities combining nonlinearity with dispersion. Ultrafast manipulation [14,15], pulse shaping [16,17], and biomedical imaging [18–23] require accurate measurements of the SOP of ultrafast lasers. Nevertheless, since high-speed detection and wavelength-resolved measurements cannot be simultaneously achieved by commercial polarization analyzers or channeled spectropolarimeters [24], single-shot measurements of the wavelength-resolved SOP of ultrafast laser pulses have, to our knowledge, rarely been reported.
Well-established polarization measurement methods have been proposed for characterizing continuous wave (CW) laser emission. However, methods such as time sharing or rotating wave plates suffer the disadvantage of low speed of operation [25,26]. Although beam splitting methods, such as the division-of-amplitude, where four components of rapidly varying signals can be simultaneously detected [27–31], permit high-speed SOP detection, they fail to be wavelength resolved, due to their lack of capability to perform high-speed measurement of wide spectrum data. Therefore, combining high-speed SOP detection with wavelength-resolved measurement is essential for carrying out single-shot measurements of the wavelength-resolved SOP from ultrafast lasers.
In this paper, we propose and experimentally demonstrate a new method for the single-shot measurement of wavelength-resolved SOP for ultrafast lasers. Our approach is based on combining the division-of-amplitude technique with the dispersive Fourier transform (DFT) method. In previous work, temporal–spectral mapping through time-stretching DFT was utilized for characterizing the rapidly evolving spectra from ultrafast lasers [12,13,32–43]. Here, we decompose the single-shot spectra by projecting them in a spatial optical module based on the division-of-amplitude principle. This permits us to detect the four intensity components necessary to obtain the SOP by means of a high-speed photodetection system. After calibrating our SOP detection system matrix by means of a CW laser with tunable wavelength, we are able to reconstruct a wavelength-resolved set of Stokes parameters. Our method is tested on a typical type of ultrafast laser, the dissipative soliton (DS). We identify wavelength-dependent SOP structures in a DS laser operating in the net normal cavity dispersion regime. Our method may thus lead to finding new regimes of fascinating SOP evolution dynamics in the emission of ultrafast lasers. These dynamics are otherwise hidden from us when SOP information is neglected in the study of ultrafast lasers.
Sign up for Photonics Research TOC. Get the latest issue of Photonics Research delivered right to you!Sign up now
2. PRINCIPLE
The precise SOP measurement of any ultrafast laser can be achieved by obtaining the wavelength-resolved Stokes parameters with a high-speed detection system. As shown in Fig. 1, a single-shot spectrum measurement is performed via DFT within a section of dispersion compensation fiber (DCF). Due to the large group velocity dispersion, ultrafast pulses propagating in a DCF undergo far-field transformation. When neglecting higher-order dispersion terms, a linear wavelength-to-time mapping is obtained according to the relationship [32]
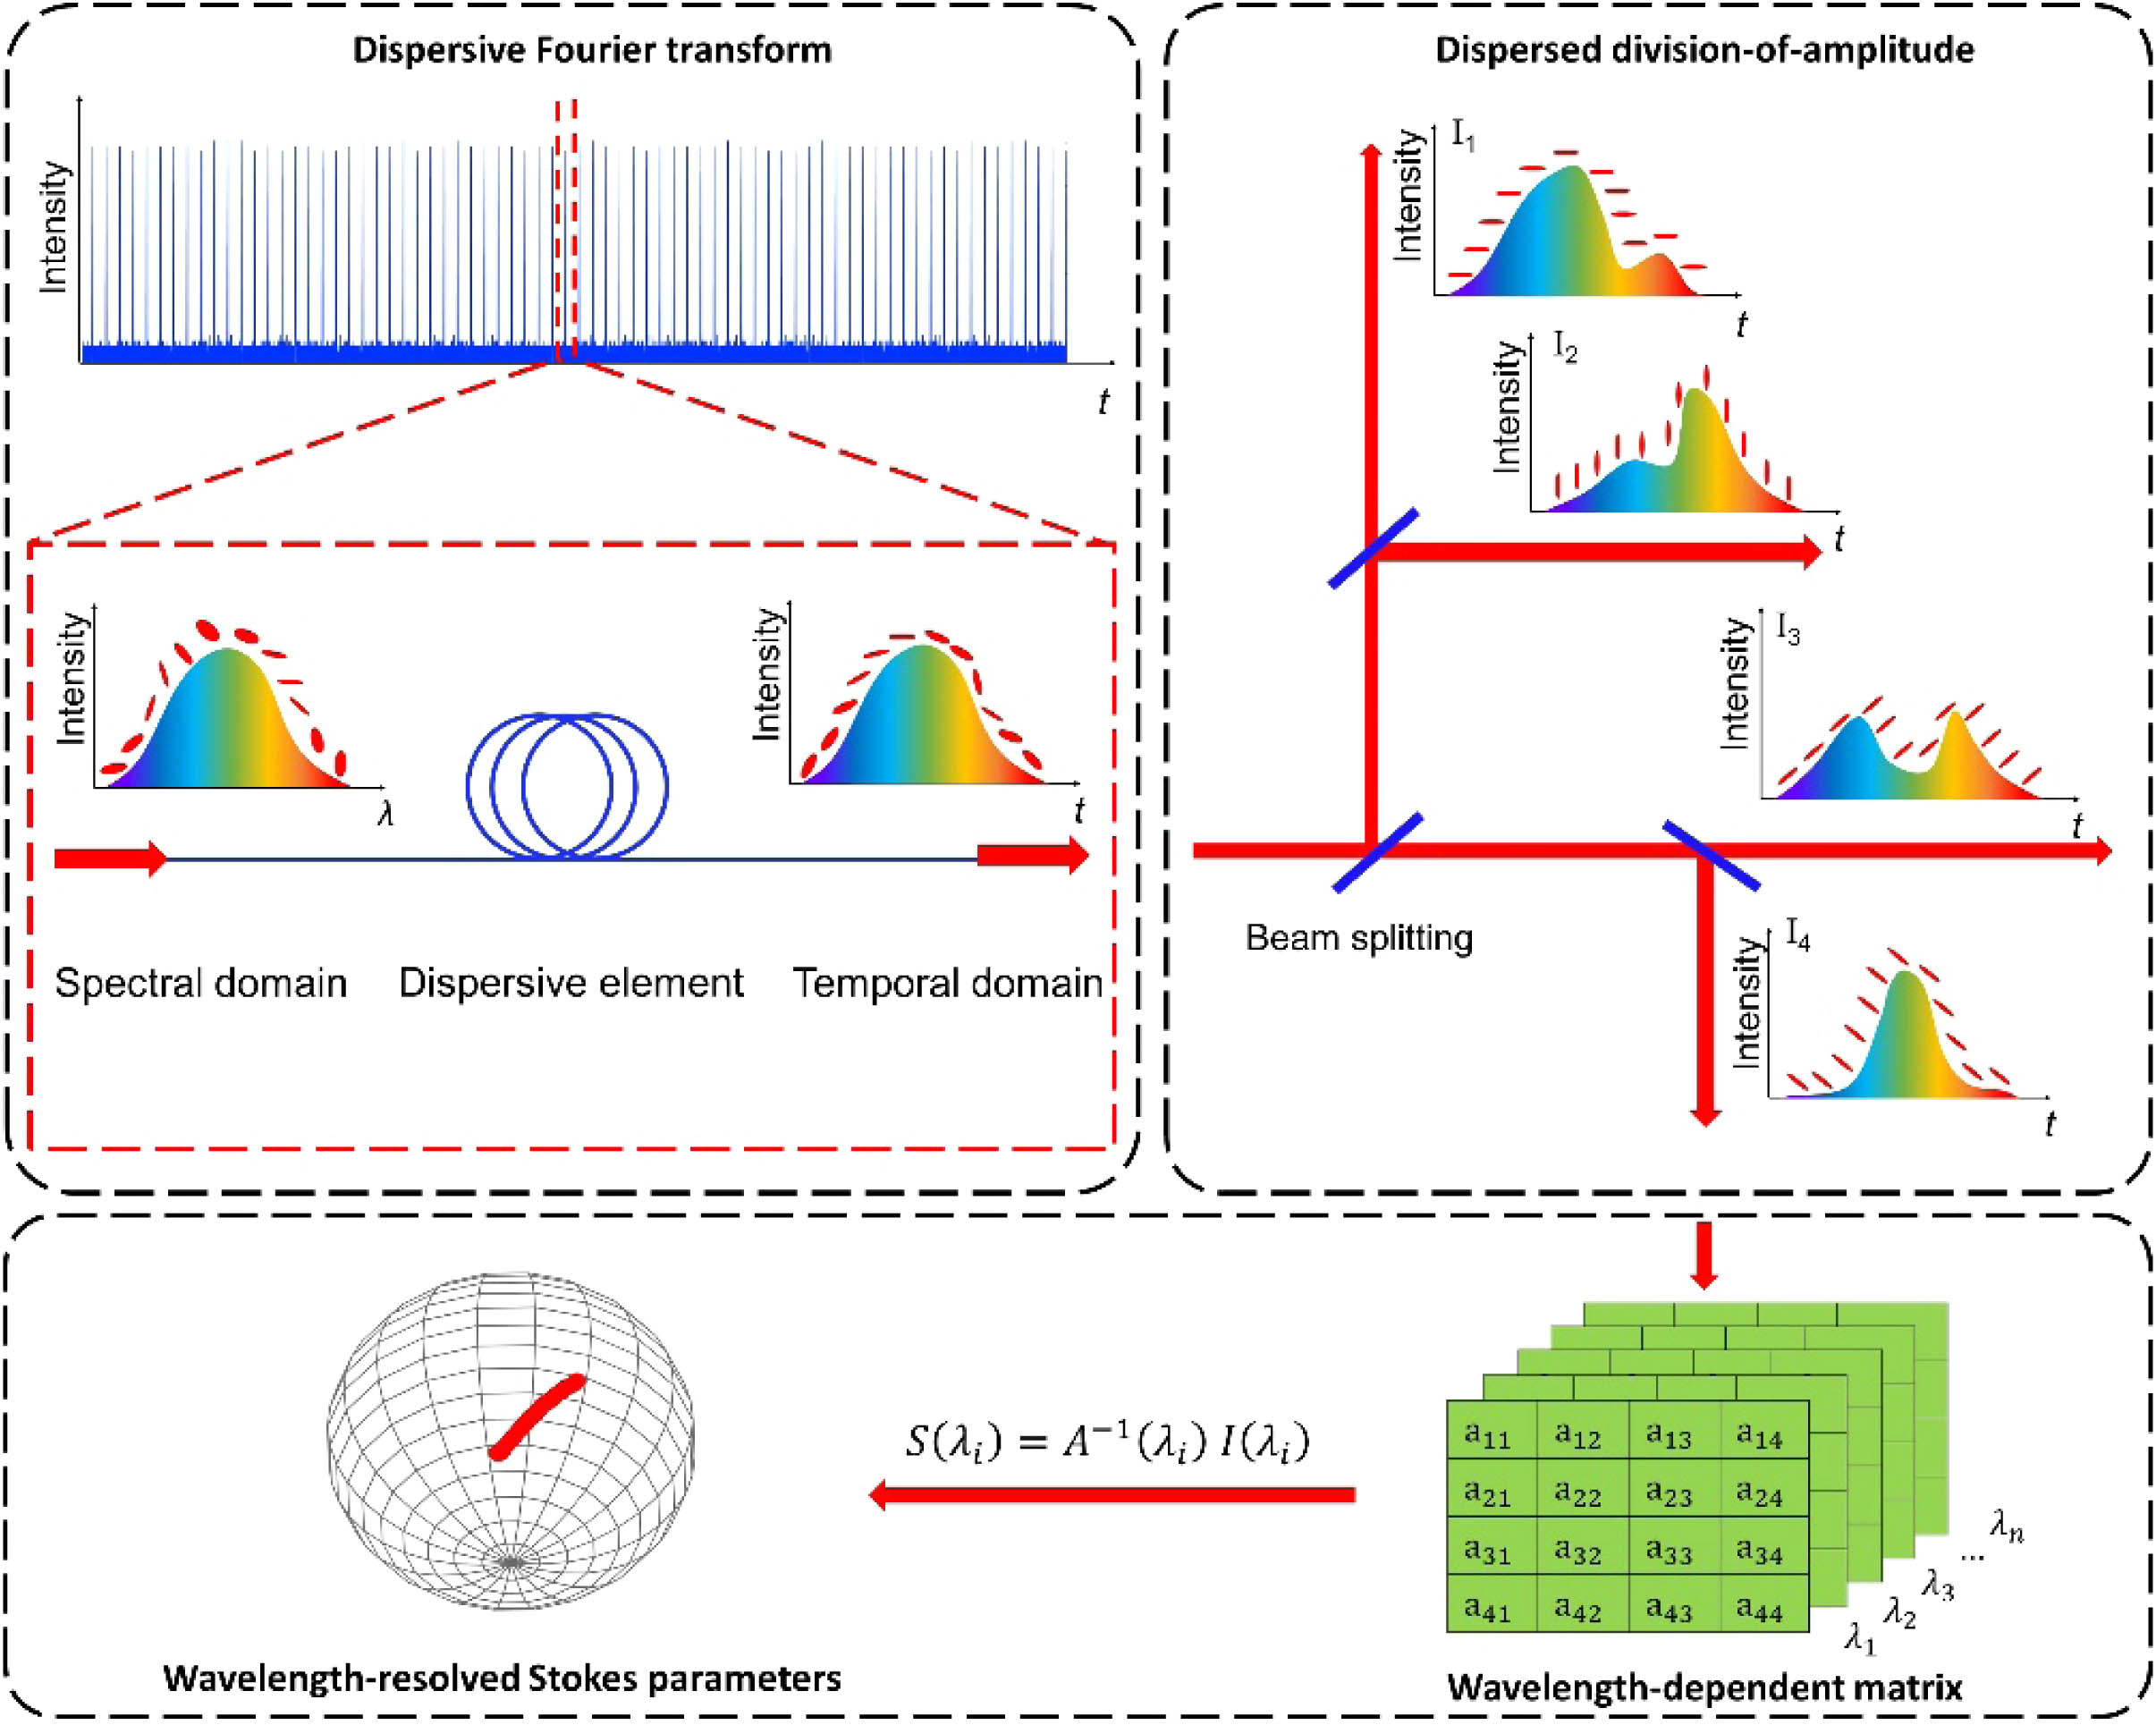
Figure 1.Principle of DFT and dispersed division-of-amplitude method. An ultrafast pulse is time-stretched, and the optical spectrum is mapped into the temporal domain, under the far-field approximation imparted by propagation in a dispersive medium. Next, the dispersed signal is split into four channels, and after calibration of each individual wavelength, a wavelength-resolved system matrix is built.
After time stretching, the dispersed pulses are split into four optical channels by the division-of-amplitude technique [27,28]. For each individual wavelength
Some additional SOP parameters can be deduced from the Stokes parameters. For example, the spherical orientation angle
3. EXPERIMENTAL SETUP
As schematically depicted in Fig. 2, the DS ring cavity contains 20 m of erbium-doped fiber (EDF) with a dispersion of
![]()
Figure 2.Schematic of the fiber laser cavity and measurement system containing a 980 nm pump laser (Pump), erbium-doped fiber (EDF), wavelength division multiplexer (WDM), saturable absorber (SA), polarization-independent isolator (ISO), polarization controller (PC), optical couplers (OC1, OC2), dispersion compensating fiber (DCF), erbium-doped fiber amplifier (EDFA), optical spectrum analyzer (OSA), collimators (C0–C4), beam splitters (BS1–BS3), analyzers (P1–P4), quarter-wave plate (Q1), polarization state generator (PSG), photodetectors (PD1–PD4), and digital oscilloscope. Blue lines denote laser beams propagating in fiber, and red lines indicate free-space laser propagation. Black lines are electrical signals.
4. RESULTS AND DISCUSSION
A. Calibration of the Measuring System
Before carrying out the measurements, the system of division-of-amplitude needs to be calibrated first, so the wavelength-dependent system matrix
Figure 3 depicts the calibration results based on the equator-poles method. The four vectors of SOP are
![]()
Figure 3.Calibration of division-of-amplitude. (a)–(c) Theoretical value (black solid curve) and experimental points (colored circles) of
B. SOP Measurements of Dissipative Solitons
When optical gain is provided by a 20 m EDF with normal dispersion, we obtain the generation of a DS in the dissipative fiber laser cavity, due to a balance of nonlinearity, dispersion, gain, and loss [33–35,44,45]. As shown in Fig. 4(a), the averaged optical spectrum ranges from 1561 to 1573 nm at the pump power of 28 mW. As the pump power is further increased, the wave-breaking-free rectangle shaped DS spectrum is gradually broadened. For the DFT method, higher order dispersion could distort the linear mapping from the spectral domain to time domain. In theory, higher order dispersion can be compensated for by fiber with inverse dispersion. The comparison between the averaged spectrum and that retrieved from a temporal waveform obtained by the DFT method is given in Fig. 4(a). As we can see, clear consistency is shown and the deviation comes from the EDF amplifier. Due to the negative dispersion of DCF, the label of a short time corresponds to that of a long wavelength. The DS autocorrelation trace is fitted by a Gaussian function, shown in Fig. 4(b), and the FWHM pulse duration is about 30 ps. Furthermore, as depicted in Fig. 4(c), we filtered the broad spectrum by a tunable optical filter (Santec, OTF-320) with a bandwidth of 0.2 nm: the corresponding SOPs along all of the filtered wavelengths were measured by means of a polarization state analyzer (General Photonics, PSGA-101-A). As can be seen, a nonlinear trajectory was obtained for the wavelength evolution of the SOP on the Poincaré sphere. The corresponding phase plane trajectory, based on the spherical orientation angle
![]()
Figure 4.Characteristics of DS. (a) Optical spectra measured by OSA for pump powers ranging from 28 to 32 mW. The corresponding bandwidth increases from 12 to 14 nm. For comparison, retrieved temporal waveform obtained by DFT for the pump power of 28 mW is shown (red line). (b) Autocorrelation trace of a DS under 28 mW and the corresponding Gaussian fitting curve. The full width at half maximum (FWHM) of pulse duration is about 30 ps. (c) SOPs measured by a commercial polarization analyzer, when the broad spectrum under 28 mW is filtered linearly from 1561 to 1573 nm by a tunable filter, denoted by black arrow. (d) Phase diagram based on the spherical orientation angle
To unveil these dynamics, we performed single-shot wavelength-resolved transient SOP measurements during the build-up phase of the DS, when the pump power is switched on from zero up to 28 mW. The single-shot spectra detected within the four channels are shown in Figs. 5(a)–5(d). There are more than 9000 round trips with a temporal period of 134 ns. Here, the spectral information of the DS is time-stretched into 7.2 ns via DFT. In our detection system, any slight difference of arrival times within the four channels can be compensated for by precisely tuning the optical paths. Based on the detected spectral intensities in the four channels, and the inverse matrix of the division-of-amplitude system, we managed to reconstruct the wavelength-resolved evolution of the normalized Stokes parameters.
![]()
Figure 5.(a)–(d) Single-shot spectra of four channels (CH1–CH4) associated with the DS, when the pump power is 28 mW. Regions I, II, and III in the build-up process correspond to spectrum broadening, spectrum oscillation, and stable mode-locking, respectively, and are marked by semitransparent white stripes. The associated numbers of round trips are 1100th–1400th, 4800th–5100th, and 9000th–9300th, respectively. (e)–(g) Reconstructed wavelength-resolved SOPs for three selected regions of DSs. SOPs evolve from a random distribution towards concentrated and ordered island. (h) Reconstructed wavelength-resolved SOPs in region III for pump powers of 28, 29, and 31 mW.
Specifically, in Figs. 5(a)–5(d) three regions, I, II, and III, are selected: each shows distinct dynamics. For region I, spectral broadening is initiated via self-phase modulation, and it is followed by spectral intensity fluctuations. As shown in Fig. 5(e), the corresponding SOP distribution is randomly distributed on the Poincaré sphere, in particular for wavelengths at the spectrum edges. Within region II, the broadened spectrum oscillates periodically: in Fig. 5(f), the corresponding SOP distribution appears to occupy specific regions on the Poincaré sphere. Whenever stable DSs are formed, such as in region III, the stable mode-locking mechanism appears to dominate the SOP evolution process. As depicted in Fig. 5(g), the SOPs are distributed within island-shaped regions. These single-shot results are different from the observations reported in Figs. 4(c) and 4(d), and the difference originates from the distortion induced by the tunable filter or fiber between OC1 and the commercial polarization analyzer. These two optical components distorted the absolute SOP of the output after the cavity. In fact, another wavelength-resolved polarization distribution for DSs using a filter-based conventional method has been obtained [12], which is more similar to the single-shot results. The point is that the time-averaged and distorted data for stable DSs are not accurate enough, when compared with those obtained from our proposed method, let alone for DSs with transient polarization dynamics. The physical mechanism behind the observed SOP dynamics can be associated with the large nonlinear frequency chirp of DSs, which eventually leads to a variation of the SOP for its different spectral components [44,45]. By increasing the pump power, the nonlinear chirp grows larger. This can be revealed by comparing the wavelength-resolved SOPs of stable DSs for different pump powers. As shown in Fig. 5(h), the SOP trajectories for three values of pump power are similar in the middle of the spectrum, both exhibiting zig-zag-shaped fluctuations. For wavelengths at the spectrum edges, intense SOP fluctuations occur, whose detailed behavior cannot be quantitatively resolved.
To quantitatively compare the differences in SOP evolutions within different round trips, in Fig. 6, we report the measured Stokes parameters. For wavelengths around 1561 nm in regions I and II, the Stokes parameters experience intense fluctuations, since they are associated with the newly generated frequencies that grow in the process of spectrum broadening [Figs. 6(a) and 6(b)]. For region III, associated with stable mode-locking, the Stokes parameters appear to be stabilized [Fig. 6(c)]. It should be pointed out that measuring Stokes parameters with zero values does not mean that the light depolarized. This is because in our data processing, we removed the Stokes parameter points whenever the intensities of the four channels were at low levels of electronic noise.
![]()
Figure 6.(a)–(l) Stokes parameters evolution versus number of round trips for wavelengths at 1561, 1564, 1567, and 1570 nm, respectively, in regions I, II, and III of Fig.
For wavelengths of 1564 and 1570 nm in region I [Figs. 6(d) and 6(j)], intense oscillations and polarization conversion are observed in the process of spectral broadening, whereas the corresponding Stokes parameters remain stable in regions II and III. For the wavelength at 1567 nm, namely, near the central part of the spectrum, the Stokes parameters always vary slightly, which suggests that SOPs within the central part of the spectrum are less affected by the process of DS build-up. As depicted in Figs. 6(m)–6(o), we computed the mean values and standard deviations of the Stokes parameters at the four selected wavelengths as a function of the number of round trips in regions I, II, and III, respectively. As can be seen, the SOPs of wavelengths located at the spectrum edges fluctuate more intensely than SOPs for the central portion of the spectrum, which is consistent with the previously discussed behavior. The observed large fluctuations originate from both the measurement error and the unique SOP dynamics of the DSs. Measurement error induced by electronic noise cannot be completely eliminated when the low light intensities of the four channels are close to the electronic noise level. In our experiments, electronic noise is at about 4 mV. Therefore, the lowest power of signals that can be resolved should be higher than 4 mV.
C. Discussion
In our measurement system, several key parameters can be optimized, including the detection bandwidth, spectral resolution, and detecting precision. Primarily, the detection bandwidth of the measurement system is essentially determined by the optoelectronic components, including the bandwidth of the photodetector, the sampling rate of the digital oscilloscope or other electronic digitizers, and possibly the data processing speed, whenever a real-time measurement is desired. Key factors that limit the spectral resolution include group velocity dispersion, sampling rate of the oscilloscope, and analog bandwidths of the oscilloscope and detector. The mathematical expression can also be found in detail in Ref. [32]. In our system, a spectral resolution of 0.2 nm is obtained. Yet, this can be further reduced down to 0.08 nm by using 2 km of DCF and 20 GHz photodetectors. Of course, the nonlinearity of wavelength-to-time mapping, and the repetition rate of ultrafast lasers will limit the optimization of the available spectral resolution.
The detecting uncertainty, which can be partially revealed by the observed large SOP fluctuations, originates from the fact that we are measuring the wavelength-resolved SOPs of an ultrafast laser, rather than the SOPs of a single-frequency CW laser. When a Mueller matrix is performed, as occurs in the division-of-amplitude method, the measurement process averages all elements of the Mueller matrix via a convolution process, and the instrument response function is determined by the various instrument uncertainties, such as measurement time (determined by the bandwidth of our optoelectronics components) and spectral resolution [46,47]. For commercial polarization analyzers used with CW lasers at low measurement speed, the photocurrents detected by the photodetectors are integrated over a relatively long measurement time and a wide spectral bandwidth. Therefore, the obtained SOPs in Fig. 4(c) appear to be more stable and localized. In our case, the measurement time is much shorter, and the spectroscopy conducted through DFT further reduces the detected photocurrents, leading to larger uncertainties. Moreover, the measurement system, consisting of fiber, is sensitive to environmental vibration and temperature change, and these environmental factors would induce phase variation and birefringence of fibers, also resulting in detecting uncertainty. In the future, the environmental sensitivity can be reduced by free-space optics systems or on-chip integration systems.
SOPs measured by our system are consistent with the filtering results in Figs. 4(c) and 4(d) to a certain extent, which suggests that wavelength-dependent characteristics of SOPs under wavelength-resolved single-shot measurement are indeed the intrinsic feature of DS. Yet, our measured SOPs are not exactly the same as those from the output of laser cavity, due to fiber-induced variation of SOPs through propagation between OC1 and C0. Nevertheless, the relative difference of wavelength-related SOPs inside each DS pulse can be identified. Wavelength-dependent SOPs do exist in our DS fiber laser cavity, as no polarization-dependent device is employed in it. In fact, wavelength-resolved SOPs are already observed by a filtering method [12], which implies that the dispersed DCF is not the reason for the observation of wavelength-dependent SOPs. Another point that should be noticed is that vector solitons revealed by DFT together with polarization orthogonal decomposition (i.e., polarization beam splitter) have been reported [3,4,6,8], but wavelength-resolved SOPs cannot be obtained from just two linear decomposition methods. On the contrary, for the method of division-of-amplitude that we used here, both linearly polarized and circularly polarized input signals can be recognized by virtue of polarizers and phase retarders. As a result, full-Stokes information can be obtained by the method proposed here, and it is anticipated that the wavelength-related, full-Stokes analysis would play a crucial role in the field of imaging and biomedical diagnosis.
Given the strong temporal–spectral correlation for ultrafast lasers, which is different from CW or quasi-CW lasers with single frequencies, it is worth discussing the physics of wavelength-resolved polarizations. According to the classical definition, the CW or quasi-CW laser is a kind of static or quasi-static electromagnetic field vector; the polarization is in the direction of the electric field or magnetic field for a single wavelength (or frequency). As they hold for a certain period, their polarization states can be determined precisely by time averaging. However, ultrafast lasers, through mode-locking, have broad spectra (thousands of longitudinal modes), and they are highly temporally–spectrally correlated. Therefore, for instantaneous electromagnetic field vectors, such as femtosecond lasers, the direction of the electric or magnetic field holds only for an ultrashort period, which is inaccessible for any electronic devices with limited responses. Due to the temporal–spectral correlation, the polarizations (or directions) across the lasing wavelengths can be measured in the spectral domain. Our proposed single-shot measurement, by combining DFT and division-of-amplitude, provides a reliable way to find the polarization distribution in the spectral domain. Further investigation and discussion about the physics are needed.
5. CONCLUSION
In conclusion, we demonstrated a new system for wavelength-resolved, high-speed SOP measurement, by combining the method of division-of-amplitude together with DFT under the far-field transformation. When the single-shot spectrum measurement by DFT is extended via the division-of-amplitude method, the wavelength-resolved SOP measurement for each optical pulse is achieved with high speed, by reconstructing the Mueller matrix. As a proof-of-concept demonstration, we experimentally investigated the nonlinear wavelength-resolved polarization dynamics in the build-up process of DSs. We believe that our SOP measurement method will find applications in fundamental physics, such as ultrafast laser measurements and studies of nonlinear optical processes, and will also expand the capabilities of different polarization-related techniques, such as pulse shaping and hyperspectral polarization imaging.


Set citation alerts for the article
Please enter your email address

© Copyright 2018-2021 | Chinese Laser Press. All Rights Reserved 沪ICP备15018463号-20