• Photonics Research
  • Vol. 11, Issue 5, 887 (2023)
Zewei Luo1、2、†, Ge Wu1、2、†, Mengting Kong1、2, Zhi Chen1、2, Zhengfei Zhuang1、2、3, Junchao Fan4、5、*, and Tongsheng Chen1、2、3、6、*
Author Affiliations
  • 1Key Laboratory of Laser Life Science, Ministry of Education, College of Biophotonics, South China Normal University, Guangzhou 510631, China
  • 2Guangdong Key Laboratory of Laser Life Science, College of Biophotonics, South China Normal University, Guangzhou 510631, China
  • 3SCNU Qingyuan Institute of Science and Technology Innovation, South China Normal University, Qingyuan 511520, China
  • 4Chongqing Key Laboratory of Image Cognition, College of Computer Science and Technology, Chongqing University of Posts and Telecommunications, Chongqing 400065, China
  • 5e-mail: fanjc@cqupt.edu.cn
  • 6e-mail: chentsh@scnu.edu.cn
  • show less
    DOI: 10.1364/PRJ.485521 Cite this Article Set citation alerts
    Zewei Luo, Ge Wu, Mengting Kong, Zhi Chen, Zhengfei Zhuang, Junchao Fan, Tongsheng Chen. Structured illumination-based super-resolution live-cell quantitative FRET imaging[J]. Photonics Research, 2023, 11(5): 887 Copy Citation Text show less
    Diagrams of the hardware and workflow of SIM-FRET. (a) Schematic diagram of the SIM-FRET setup. AOTF, acousto-optic tunable filter; PBS, polarization beam splitter; HWP, half-wave plate; SLM, spatial light modulator; QWP, quarter-wave plate; PP, azimuthally patterned polarizer; DM, dichroic mirror; L1–L5, lenses. (b) Flow chart of the SIM-FRET, including obtaining three-channel FRET structured light modulated raw image stacks, SR image reconstruction of three-channel FRET imaging based on the linear Wiener-SIM, background subtraction and co-localization mask filtering, and quantitative acceptor sensitized emission FRET measurement with co-localization mask filtering.
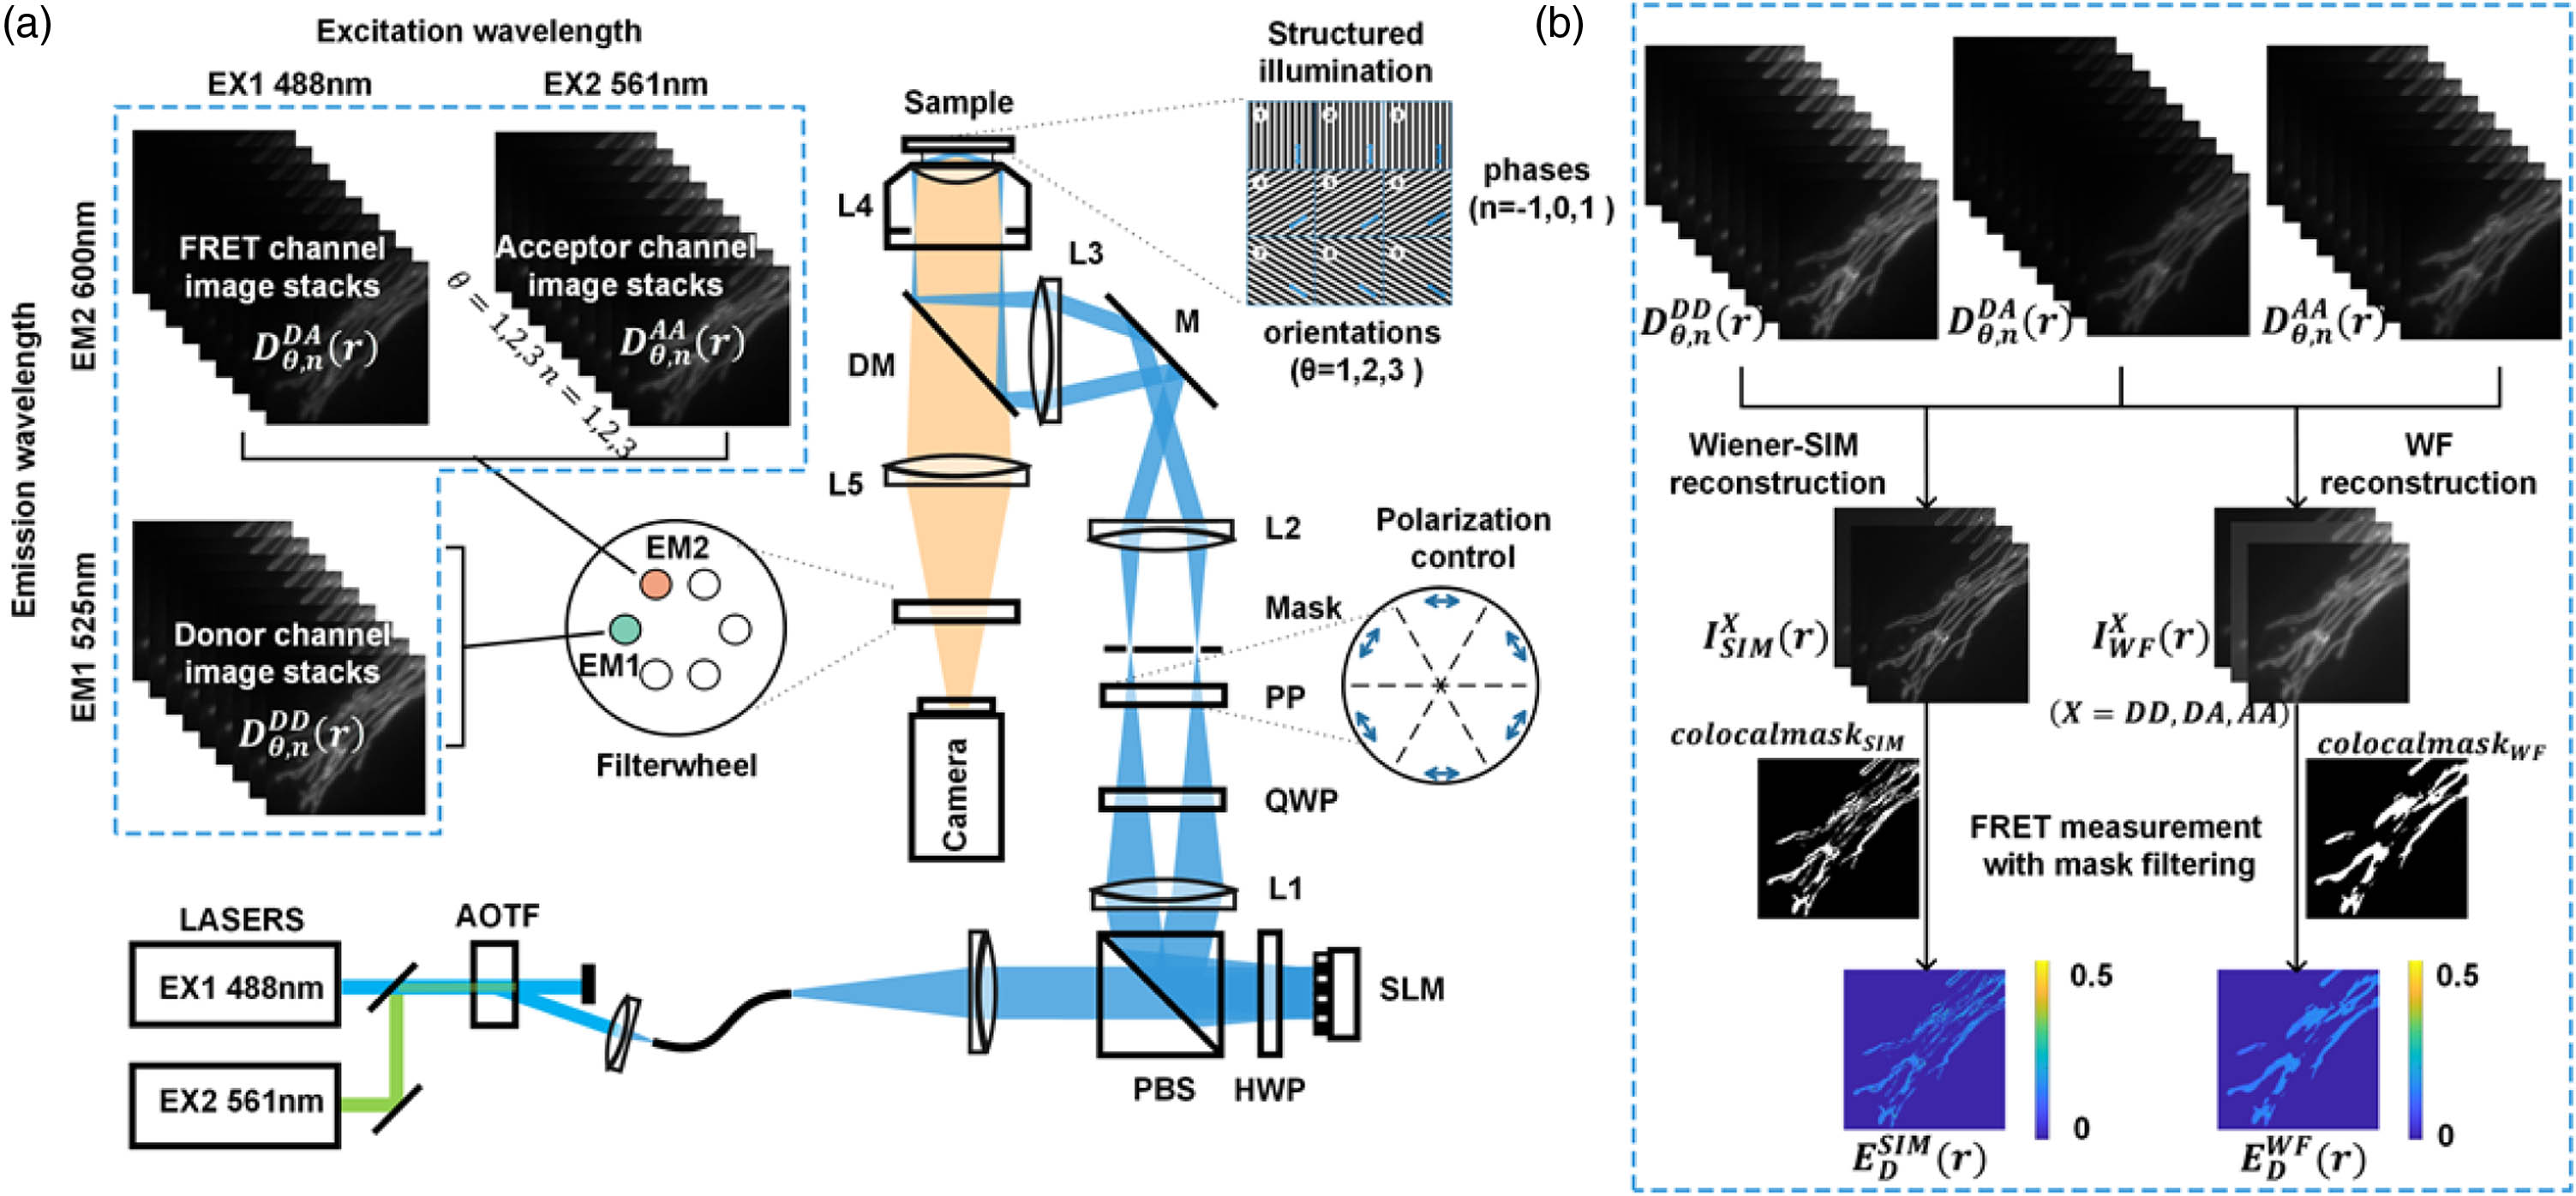
    Fig. 1. Diagrams of the hardware and workflow of SIM-FRET. (a) Schematic diagram of the SIM-FRET setup. AOTF, acousto-optic tunable filter; PBS, polarization beam splitter; HWP, half-wave plate; SLM, spatial light modulator; QWP, quarter-wave plate; PP, azimuthally patterned polarizer; DM, dichroic mirror; L1–L5, lenses. (b) Flow chart of the SIM-FRET, including obtaining three-channel FRET structured light modulated raw image stacks, SR image reconstruction of three-channel FRET imaging based on the linear Wiener-SIM, background subtraction and co-localization mask filtering, and quantitative acceptor sensitized emission FRET measurement with co-localization mask filtering.
    Simulative results demonstrate the resolution enhancement and quantitative fidelity of SIM-FRET. (a) Top panel, three-channel super-resolution images of simulation FRET models; bottom panel, corresponding pseudo-color map of FRET efficiency. (b) FRET efficiency images of ground truth, WF-FRET, and SIM-FRET, respectively. (c) Corresponding histograms of (b). (d) Intensity profiles along the white solid lines in (b). Scale bar: 50 pixels.
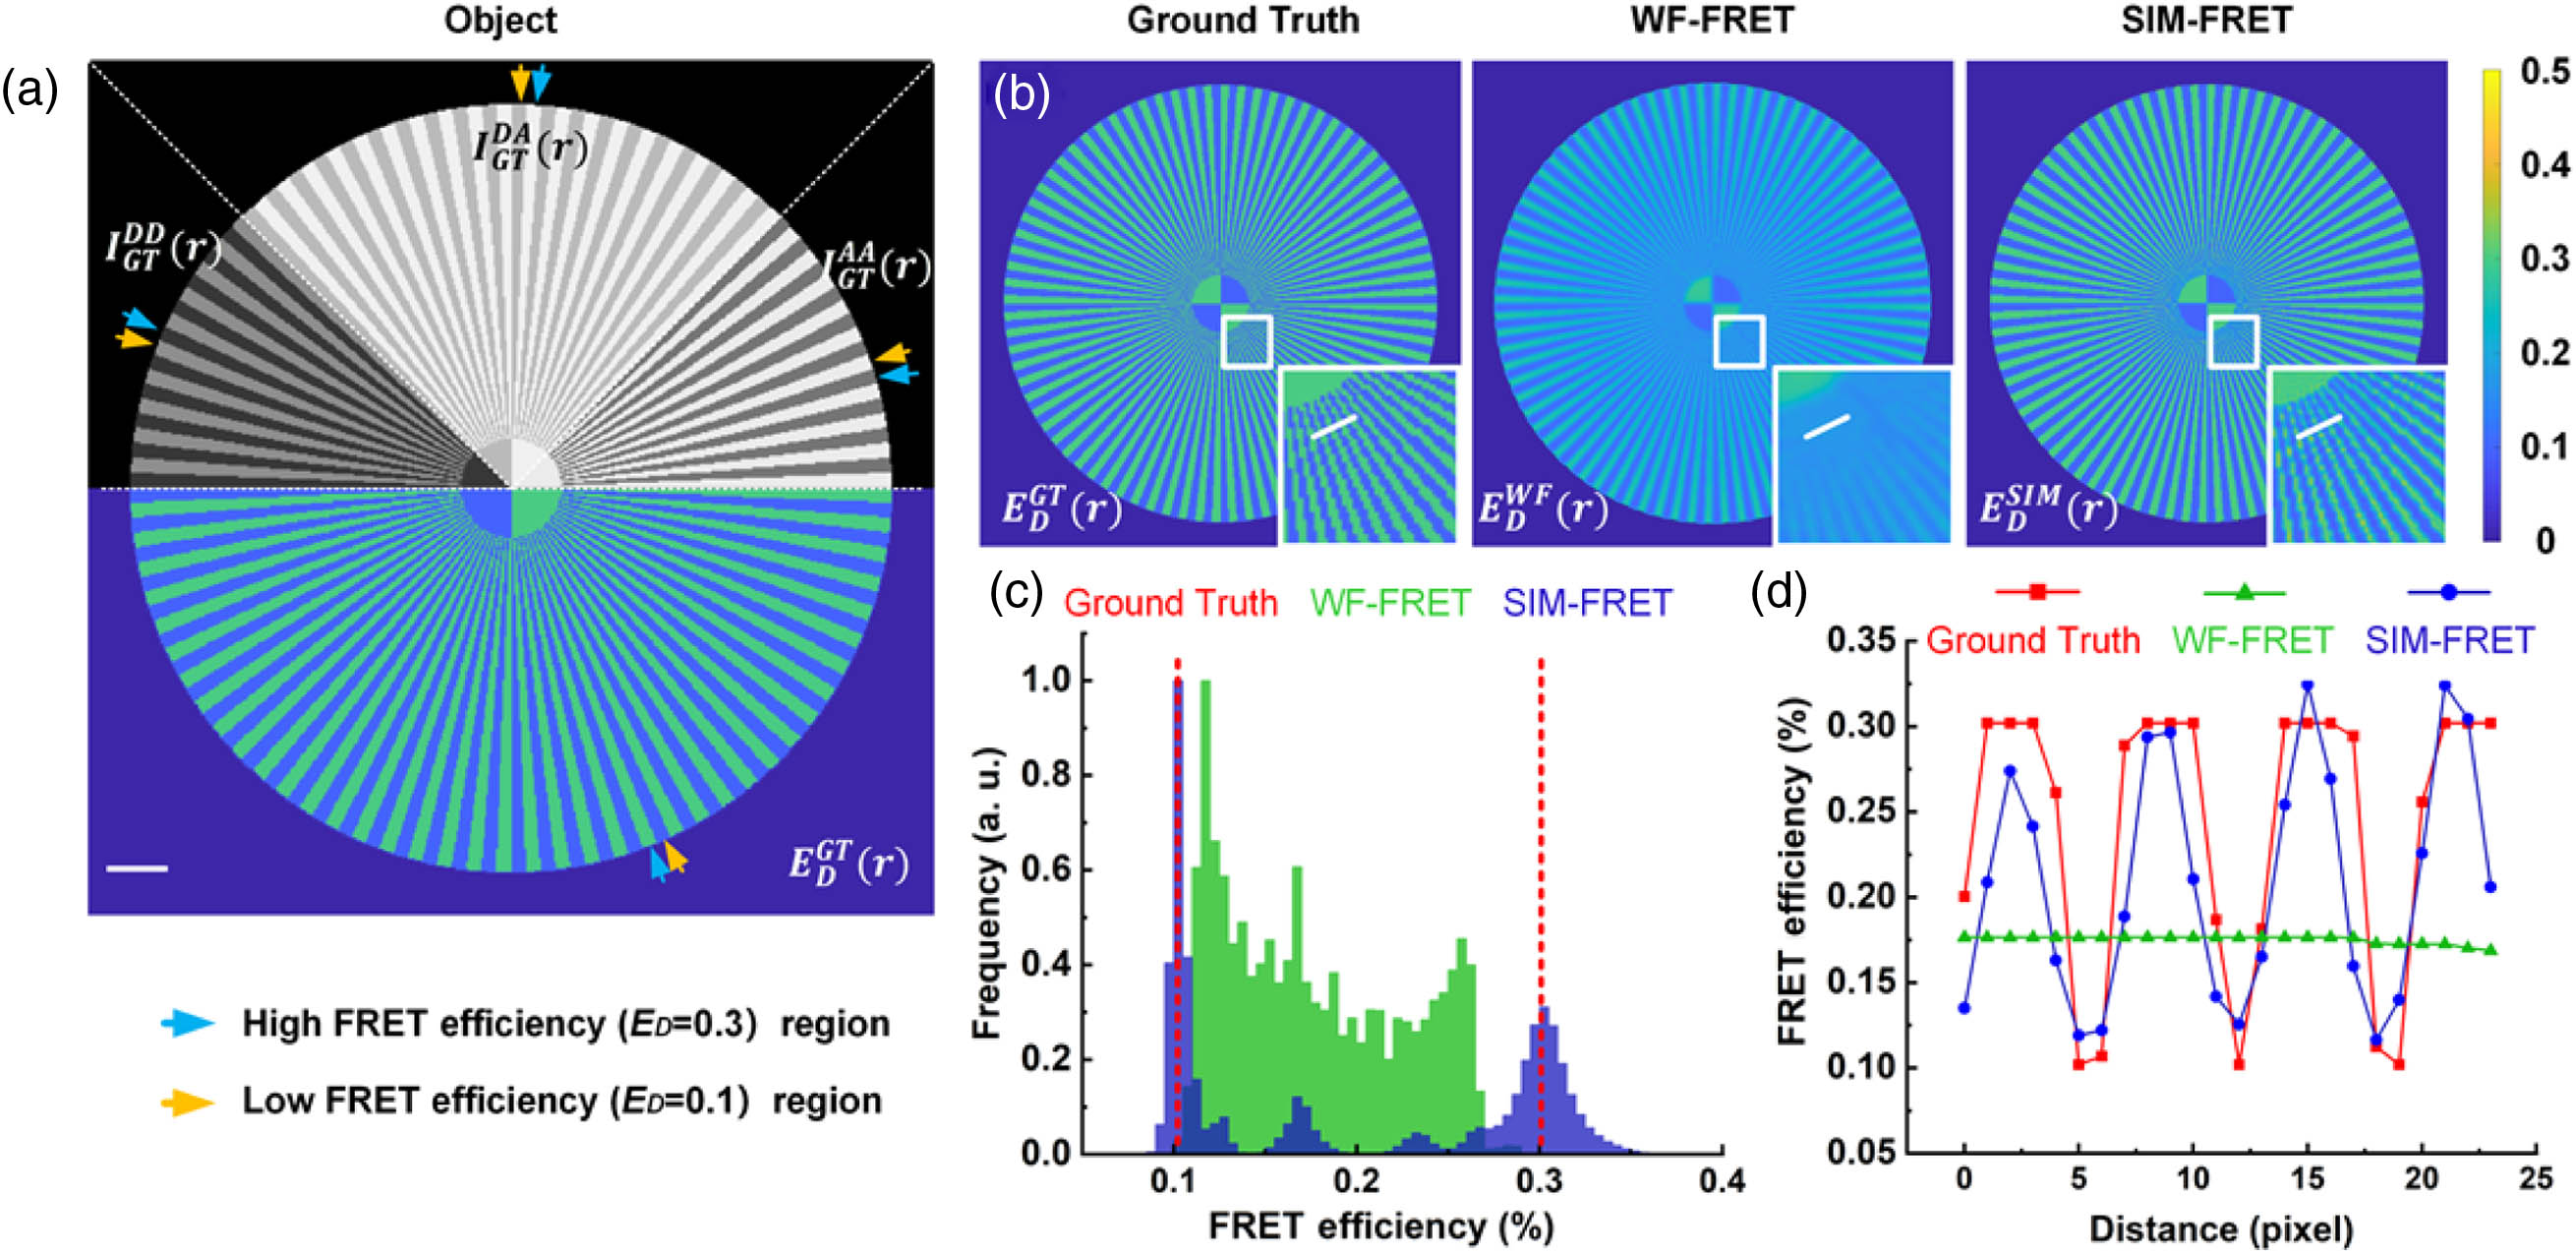
    Fig. 2. Simulative results demonstrate the resolution enhancement and quantitative fidelity of SIM-FRET. (a) Top panel, three-channel super-resolution images of simulation FRET models; bottom panel, corresponding pseudo-color map of FRET efficiency. (b) FRET efficiency images of ground truth, WF-FRET, and SIM-FRET, respectively. (c) Corresponding histograms of (b). (d) Intensity profiles along the white solid lines in (b). Scale bar: 50 pixels.
    Resolution enhancement of SIM-FRET. (a) AA channel SR-SIM and WF images of outer mitochondrial membrane (OMM) targeted FRET-standard construct ActA-G17M. (b) Decorrelation analysis results corresponding to AA channel SR-SIM and WF images. (c) Intensity profiles of the yellow and blue solid lines in the close-up views in (a). Scale bars: 2 μm.
    Fig. 3. Resolution enhancement of SIM-FRET. (a) AA channel SR-SIM and WF images of outer mitochondrial membrane (OMM) targeted FRET-standard construct ActA-G17M. (b) Decorrelation analysis results corresponding to AA channel SR-SIM and WF images. (c) Intensity profiles of the yellow and blue solid lines in the close-up views in (a). Scale bars: 2 μm.
    Performance of the co-localization mask filtering algorithm in SIM-FRET measurement. (a), (b) Pseudo-color images of ED and RC of OMM-targeted FRET-standard construct ActA-G17M when using (upper right) or not using (lower left) co-localization mask filtering. (c), (d) Corresponding histograms of (a), (b). Scale bars: 2 μm.
    Fig. 4. Performance of the co-localization mask filtering algorithm in SIM-FRET measurement. (a), (b) Pseudo-color images of ED and RC of OMM-targeted FRET-standard construct ActA-G17M when using (upper right) or not using (lower left) co-localization mask filtering. (c), (d) Corresponding histograms of (a), (b). Scale bars: 2 μm.
    Validation of the performance of the co-localization mask in FRET-standard construct ActA-G17M samples. (a) DD channel (green), AA channel (red), and the merge channels’ intensity images and two-dimensional fluorescence histograms of ActA-G17M in the absence of mask filtering. (b) Comparatively, results of co-localization mask filtering. Scale bars: 2 μm.
    Fig. 5. Validation of the performance of the co-localization mask in FRET-standard construct ActA-G17M samples. (a) DD channel (green), AA channel (red), and the merge channels’ intensity images and two-dimensional fluorescence histograms of ActA-G17M in the absence of mask filtering. (b) Comparatively, results of co-localization mask filtering. Scale bars: 2 μm.
    FRET ED mapping result comparison between raw and co-localization mask filtered data. (a) AA channel WF (left) and SIM (right) intensity images of ActA-G17M. (b) Pseudo-color images of WF (left) and SIM (right) ED using raw three-channel images. (c) Pseudo-color images of WF (left) and SIM (right) ED when using co-localization mask filtering. (d) Merge of intensity and ED map images. Scale bar: 2 μm.
    Fig. 6. FRET ED mapping result comparison between raw and co-localization mask filtered data. (a) AA channel WF (left) and SIM (right) intensity images of ActA-G17M. (b) Pseudo-color images of WF (left) and SIM (right) ED using raw three-channel images. (c) Pseudo-color images of WF (left) and SIM (right) ED when using co-localization mask filtering. (d) Merge of intensity and ED map images. Scale bar: 2  μm.
    Performance of quantitative SR SIM-FRET measurement in live cells. (a) Three-channel intensity WF (top) and SR-SIM (bottom) images of ActA-G17M. (b), (c) Corresponding pseudo-color images ED and RC of the sample in (a). (d) Top panel, histograms of ED in (b); bottom panel, histograms of RC in (c). (e) Top panel, comparison of the statistical ED values of SIM-FRET and WF-FRET; bottom panel, comparison of the statistical RC values of SIM-FRET and WF-FRET. (f) Close-up view of the blue-boxed region in (a). (g) Close-up view of the yellow-boxed region in (b). (h) Intensity profiles along the blue lines in (f). (i) ED profiles along the yellow lines in (g). Scale bars: 2 μm.
    Fig. 7. Performance of quantitative SR SIM-FRET measurement in live cells. (a) Three-channel intensity WF (top) and SR-SIM (bottom) images of ActA-G17M. (b), (c) Corresponding pseudo-color images ED and RC of the sample in (a). (d) Top panel, histograms of ED in (b); bottom panel, histograms of RC in (c). (e) Top panel, comparison of the statistical ED values of SIM-FRET and WF-FRET; bottom panel, comparison of the statistical RC values of SIM-FRET and WF-FRET. (f) Close-up view of the blue-boxed region in (a). (g) Close-up view of the yellow-boxed region in (b). (h) Intensity profiles along the blue lines in (f). (i) ED profiles along the yellow lines in (g). Scale bars: 2 μm.
    Typical FLIM measurement of FRET construct G17M samples. (a) Intensity image of G17M. (b) Pseudo-color images FRET efficiency of G17M. (c) Distribution of photons over time for a typical FLIM measurement on G17M. The exponential function fit (blue line) was convolved with the IRF (red line). (d) Histograms of ED in (b). (e) Comparison of the statistical ED values of WF -FRET and FLIM-FRET. Scale bars: 8 μm.
    Fig. 8. Typical FLIM measurement of FRET construct G17M samples. (a) Intensity image of G17M. (b) Pseudo-color images FRET efficiency of G17M. (c) Distribution of photons over time for a typical FLIM measurement on G17M. The exponential function fit (blue line) was convolved with the IRF (red line). (d) Histograms of ED in (b). (e) Comparison of the statistical ED values of WF -FRET and FLIM-FRET. Scale bars: 8 μm.
    Zewei Luo, Ge Wu, Mengting Kong, Zhi Chen, Zhengfei Zhuang, Junchao Fan, Tongsheng Chen. Structured illumination-based super-resolution live-cell quantitative FRET imaging[J]. Photonics Research, 2023, 11(5): 887
    Download Citation