1Key Laboratory of Laser Life Science, Ministry of Education, College of Biophotonics, South China Normal University, Guangzhou 510631, China
2Guangdong Key Laboratory of Laser Life Science, College of Biophotonics, South China Normal University, Guangzhou 510631, China
3SCNU Qingyuan Institute of Science and Technology Innovation, South China Normal University, Qingyuan 511520, China
4Chongqing Key Laboratory of Image Cognition, College of Computer Science and Technology, Chongqing University of Posts and Telecommunications, Chongqing 400065, China
Förster resonance energy transfer (FRET) microscopy provides unique insight into the functionality of biological systems via imaging the spatiotemporal interactions and functional state of proteins. Distinguishing FRET signals from sub-diffraction regions requires super-resolution (SR) FRET imaging, yet is challenging to achieve from living cells. Here, we present an SR FRET method named SIM-FRET that combines SR structured illumination microscopy (SIM) imaging and acceptor sensitized emission FRET imaging for live-cell quantitative SR FRET imaging. Leveraging the robust co-localization prior of donor and accepter during FRET, we devised a mask filtering approach to mitigate the impact of SIM reconstruction artifacts on quantitative FRET analysis. Compared to wide-field FRET imaging, SIM-FRET provides nearly twofold spatial resolution enhancement of FRET imaging at sub-second timescales and maintains the advantages of quantitative FRET analysis in vivo. We validate the resolution enhancement and quantitative analysis fidelity of SIM-FRET signals in both simulated FRET models and live-cell FRET-standard construct samples. Our method reveals the intricate structure of FRET signals, which are commonly distorted in conventional wide-field FRET imaging.
1. INTRODUCTION
Förster resonance energy transfer (FRET) microscopy is an invaluable optical technique to uncover molecular processes in biological systems [1–3]. By quantifying the donor and acceptor-centric FRET efficiency ( and ) and the concentration ratio of total acceptor to donor (), quantitative FRET assays provide unique insight for measuring dynamic protein–protein interactions and revealing the affinity and stoichiometry of intracellular complexes in living cells [4–6]. Current FRET assays are mainly implemented on conventional fluorescence microscopy, such as wide-field (WF) and confocal microscopy [7,8]. Due to the diffraction limit, conventional FRET imaging is insufficient to uncover FRET signals of molecular interactions localized in sub-diffraction areas [9]. Combined with super-resolution (SR) imaging, SR FRET can exhibit advantages with respect to reducing the spatial blur of fluorescence signals and distinguishing FRET signals from adjacent sub-diffraction regions, which is important for investigating the spatiotemporal distribution and functional state of molecules in vivo [10].
Live-cell quantitative SR FRET imaging has been highly anticipated since the advent of super-resolution microscopy [11,12]. Recently, breakthroughs in SR FRET imaging techniques based on single-molecule localization microscopy (SMLM) and stimulated emission depletion microscopy (STED) have been achieved by using fixed samples with photostable dyes, including correlated FRET-PAINT [13], FRET-FLIN [14], and STED-FRET [15]. For SMLM-based SR FRET, the imaging requires simultaneous on-switching of independently blinking donor and acceptor molecules, which is hardly compatible with studying dynamic processes occurring in living cells [15]. For STED-based SR FRET, the depletion beam used in STED modified the excited state lifetime of the donor and caused uneven photobleaching of donor and acceptor molecules. Therefore, STED-based SR FRET only provides uncalibrated FRET indices and is less quantitative than conventional FRET measurements [14,15].
On the other hand, due to higher photonic efficiency in improving spatial resolution, SR structured illumination microscopy (SR-SIM) has great advantages in observing diverse subcellular structures and their dynamics processes in living cells [16–21]. Therefore, SR-SIM provides the potential of combination with FRET to perform live-cell quantitative SR FRET imaging with high temporal resolution and low photo damage [16]. In a previous study, we demonstrated the compatibility of live-cell quantitative FRET measurement with optical sectioning SIM (OS-SIM) [22]. There is also an indirect combination of SR-SIM and WF-FRET by mapping fluorescence lifetime imaging (FLIM) data to a biological nanostructure in the same field of view (SIM + FILM) [23]. However, it is important to note that these techniques do not truly achieve super-resolution FRET. In fact, realizing SIM-based super-resolution quantitative FRET analysis in living cells remains a challenging task due to the ambiguous effects of SIM reconstruction artifacts on the FRET signal [20,24].
Sign up for Photonics Research TOC. Get the latest issue of Photonics Research delivered right to you!Sign up now
Here, to address the abovementioned challenges in quantitative SR FRET imaging of live cells, we present a SIM-based quantitative FRET imaging method (SIM-FRET). SIM-FRET is a two-step reconstruction involving linear reconstruction of three-channel SR images and FRET quantification with co-localization mask filtering. The two-step process ensures the reconstructed SIM-FRET signals maintain fidelity while precisely removing spurious FRET signals caused by SIM artifacts. Imaging experiments on simulation models and live-cell FRET-standard construct samples have been performed and verified both the resolution enhancement and quantitative analysis fidelity of SIM-FRET signals. Compared to conventional WF-FRET imaging, our method maintains quantitative properties and reveals the intricate structure of FRET signals with 120-nm resolution at a rate of 2 frames per second.
2. MATERIALS AND METHODS
A. SIM-FRET Setup
SIM-FRET is carried out by using three SR-SIM raw images obtained with combinations of donor and acceptor excitation and emission: (donor excitation, donor emission), (donor excitation, acceptor emission), and (acceptor excitation, acceptor emission). The intensity distribution of the raw data collected by each SIM-FRET channel can be described by the following equation: where subscripts and represent the index of sinusoidal illumination pattern’s orientation and phase shift; superscripts represent the index of FRET image channels; denotes the distribution of the specimen; , , and are the modulation depth, pattern wave vector, and initial phase of the sinusoidal illumination pattern, respectively; is the convolution operator; and is the point spread function (PSF) according to the detection image channel .
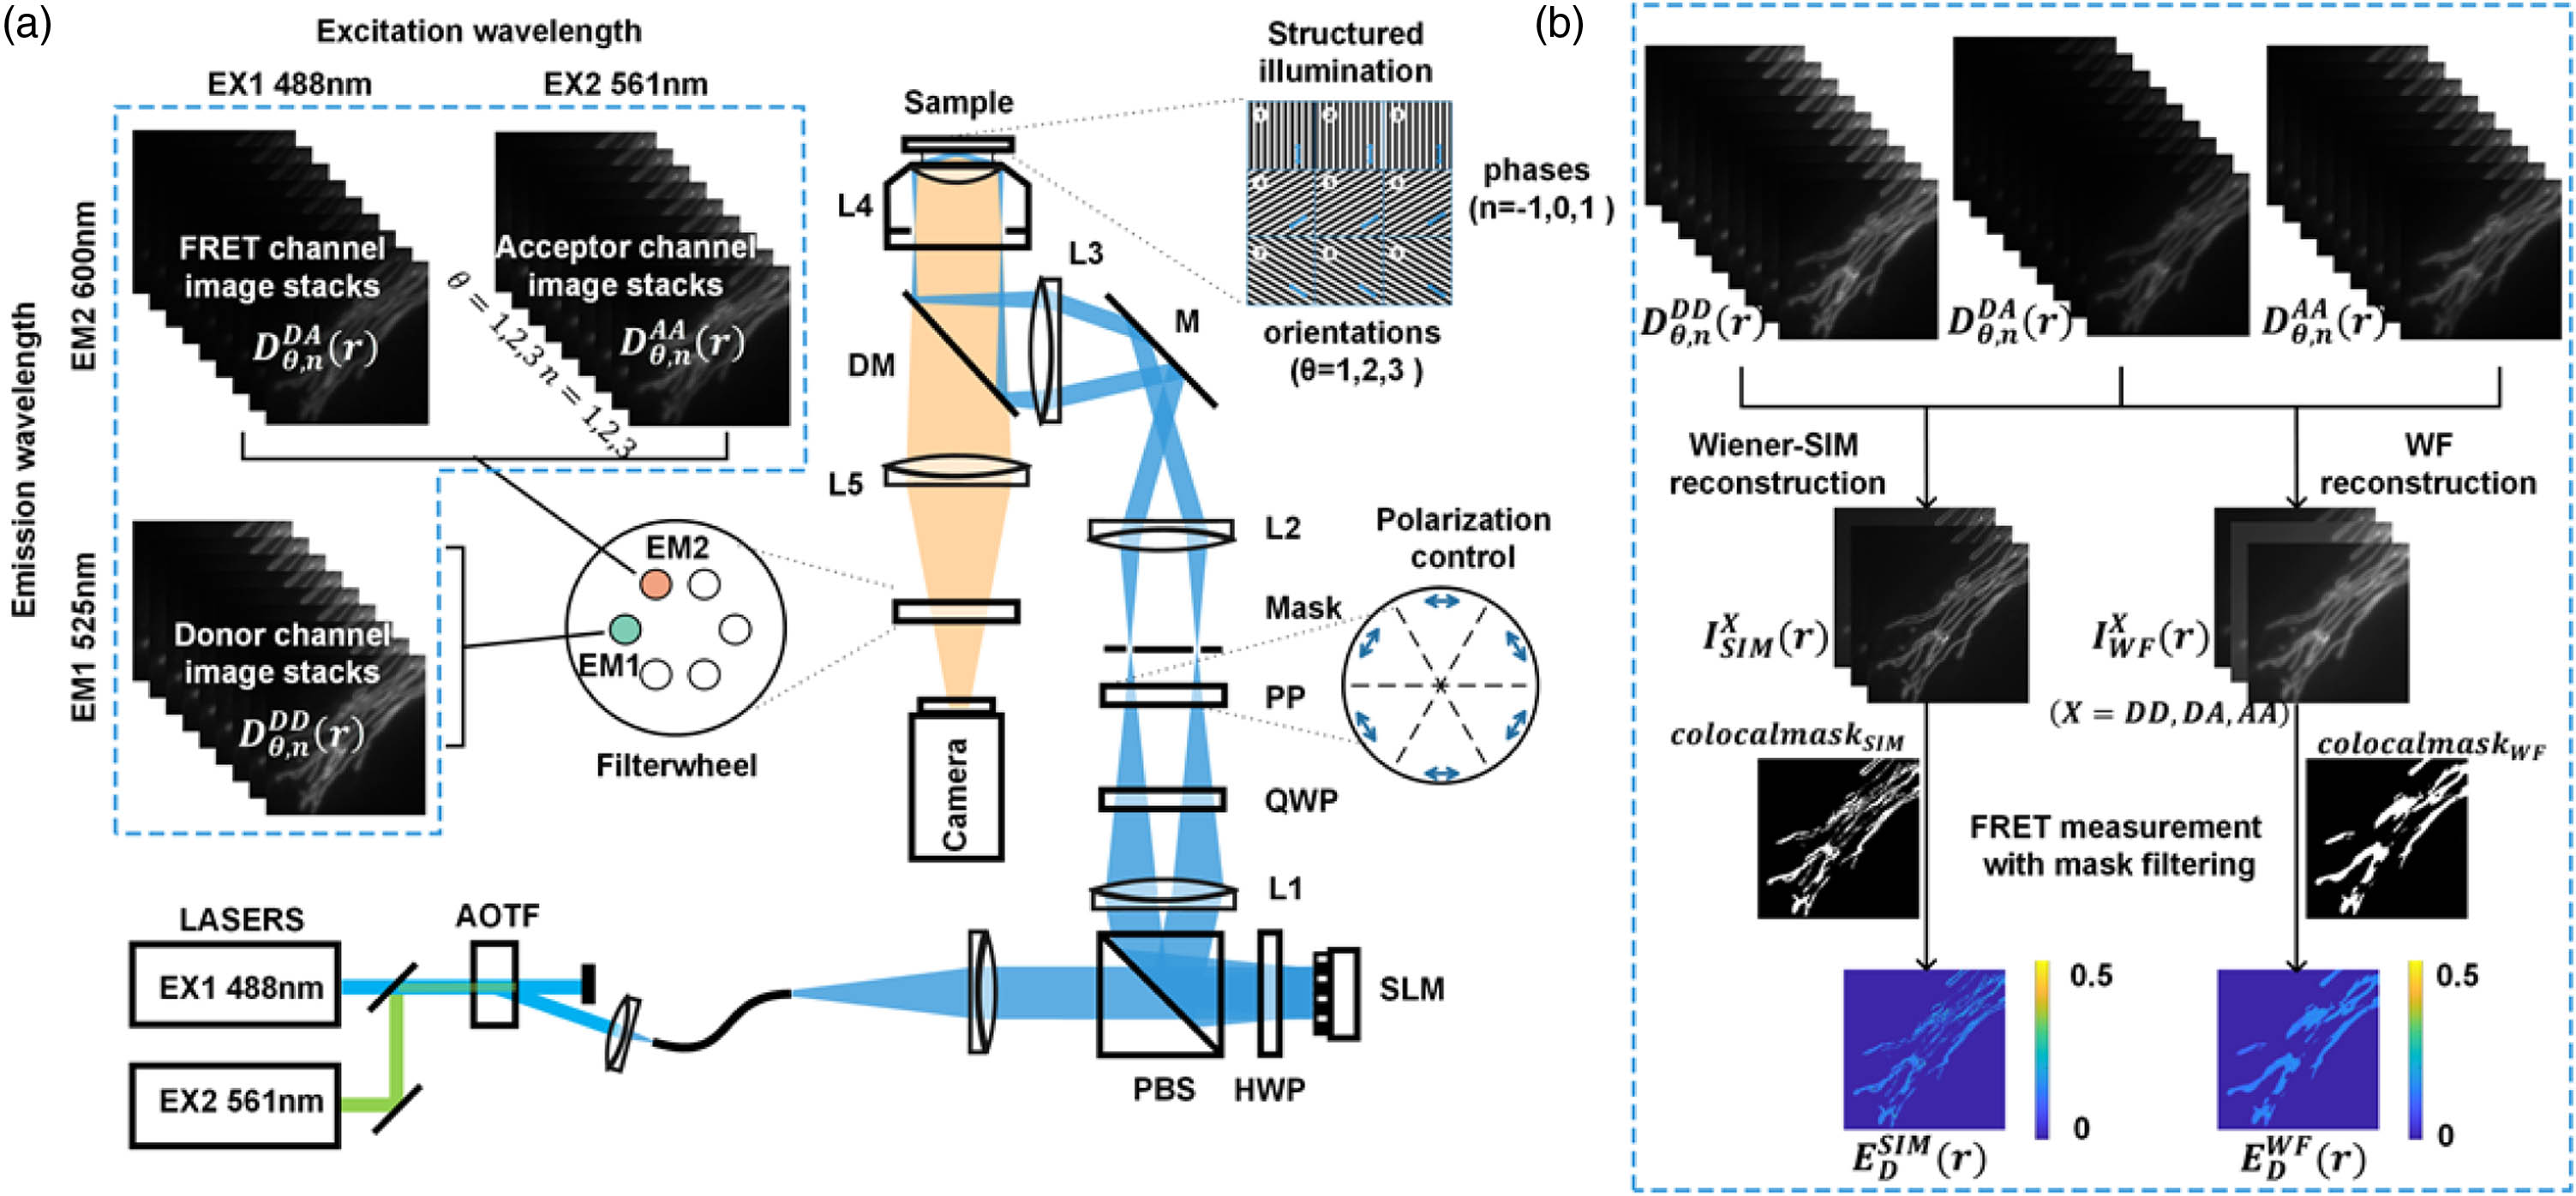
To obtain three-channel SIM-FRET raw images [], we have built a multi-color, multi-detection channel SIM system. The integrated microscopy system is shown in Fig. 1(a). In short, two laser beams with wavelengths of 488 nm (EX1, donor excitation) and 561 nm (EX2, acceptor excitation) were collinearly combined by a multicolor laser source (L4cc, Oxxius). To render the FRET index independent of the illumination power of the lasers, donor and acceptor excitation lights were calibrated to a uniform baseline, and the illumination power was adjusted in equal proportion mode. The illumination light was then expanded and collimated with a telescope system composed of two achromatic lenses. The collimated beam was diffracted by a pure phase grating consisting of a polarized beam splitter (PBS), an achromatic half-wave plate (HWP), and a ferroelectric-liquid-crystal spatial light modulator (SLM, QXGA-3DM-STR, Forth Dimension Displays). The diffraction beams modulated by the SLM were focused by an achromatic lens (L1, AC254-300, Thorlabs) onto the intermediate pupil plane, where a customized spatial mask (1 mm thick aluminum plate with a hole diameter of 0.5 mm) was placed to filter the zeroth and higher order diffraction light and to permit passage of st-ordered diffraction light only. To maximize the modulation depth of the illumination pattern, the illumination light polarization is modulated by a quarter-wave plate (QWP) and a customized azimuthally patterned polarizer (PP, VIS 038 BC3 CW01, Codixx) to ensure the polarization axis is kept parallel between different pattern orientations. The two coherent beams are then relayed onto the back focal plane of the microscope objective (L4, Apo TIRF, 60×, NA 1.49, Nikon) by a telescope system composed of Lens2 (L2, AC254-125, Thorlabs) and Lens3 (L3, AC254-200, Thorlabs). Afterward, the two beams recollimated by the objective lens interfere at the focal plane, producing sinusoidal patterns on the specimen. Fluorescence emission light from the specimen was passed through a multiband dichroic mirror (DM, DI03-R405/488/561/635, Semrock) and two band-pass emission filters including the donor emission filter (EM1, ET530/30x, Chroma) and acceptor emission filter (EM2, BA570-625, Olympus). All emission filters are mounted in a fast motorized emission filter wheel (FW103, Thorlabs). To acquire the raw images for SR-SIM, all the electrically controlled devices of the system are synchronized by a microcontroller (Arduino Uno board, Arduino) via custom-developed software written in LabVIEW (National Instruments Inc.).
Figure 1.Diagrams of the hardware and workflow of SIM-FRET. (a) Schematic diagram of the SIM-FRET setup. AOTF, acousto-optic tunable filter; PBS, polarization beam splitter; HWP, half-wave plate; SLM, spatial light modulator; QWP, quarter-wave plate; PP, azimuthally patterned polarizer; DM, dichroic mirror; L1–L5, lenses. (b) Flow chart of the SIM-FRET, including obtaining three-channel FRET structured light modulated raw image stacks, SR image reconstruction of three-channel FRET imaging based on the linear Wiener-SIM, background subtraction and co-localization mask filtering, and quantitative acceptor sensitized emission FRET measurement with co-localization mask filtering.
To ensure each reconstructed SR image maintains fluorescence intensity fidelity in three FRET channels, the linear Wiener reconstruction introduced by Heintzmann and Gustaffson [25,26] was applied in our pipeline. This linear reconstruction process consists of frequency decomposition, shifting, and deconvolution, where the initial phase and modulation depth involved are estimated using a complex linear regression [27,28]. The reconstructed SR-SIM images [] for each channel are achieved by formulas as follows: where represents the Fourier domain of the raw SIM-FRET channel images , and are the zeroth-order and st-order separated components, is the optical transfer function (OTF) of the SIM-FRET channel, is the apodization function, and is the Wiener parameter. For the simulation experiments in this paper, the OTF used is generated by a theoretical model, with parameters set to match the microscope and the three-channel FRET emission wavelength. For live-cell experiments, the OTF has been experimentally measured using 100 nm fluorescent microspheres (0.1 μm TetraSpeck Microspheres, T7279, Thermofisher). To ensure a consistent relative intensity relationship among the three channels while extending the frequency spectrum, a unified Wiener parameter and Gaussian-shaped apodization function were applied to the three-channel SIM-FRET image reconstruction, with the Wiener parameter empirically adjusted to 0.2.
From the reconstructed three-channel SR FRET images [], the background was removed based on the average intensity of the background area in each image. Then, the donor-centric SR FRET efficiency () and the concentration ratio of total acceptor to donor () are obtained by the following equations [7]: where is the FRET sensitized-quenching transition factor that is an instrument-specific calibration constant; is the fluorescence intensity ratio of donor to acceptor for equimolar concentrations in the absence of FRET; and can be predetermined using a reference sample with partial acceptor photobleaching method [29]; and , , , and are spectral crosstalk calibration coefficients, which can be predetermined using a donor-only specimen and acceptor-only specimen [30].
2. Co-Localization Mask Filtering
In practice, noise in raw images affects the performance of linear Wiener SIM reconstruction. Moreover, the reconstructions of and in SIM-FRET are even more sensitive to noise due to the division operation in Eqs. (4) and (5), which significantly enhanced the impact of noise. Since noise artifacts are randomly superimposed on the FRET three-channel image, their spatial distributions are independent of each other, thus such artifacts have a very low correlation with the FRET three-channel image. Conversely, when FRET occurs, the overlay of donor and acceptor distributions will show a strong correlation that is in excess of the random overlap. Therefore, we employed this prior information to design a co-localization mask to suppress the interference of artifacts.
To quantitatively characterize the difference between FRET signals and noise, the pixel-by-pixel co-localization analysis can be expressed as follows: where is the map for the correlation contribution of every pixel in donor and acceptor images to the Pearson correlation coefficient, is the map for the correlation contribution of every pixel in donor and acceptor images to the Manders’ overlap coefficient, is the mean value of the background-subtracted channel image, and is the mean value of the background-subtracted AA channel image. Multiplying and can obtain a mixed map, which is then binarized by an adaptive threshold algorithm [31] to obtain a co-localization mask :
With the co-localization mask filtering, the donor-centric FRET efficiency () and the concentration ratio of total acceptor to donor () are obtained by the following equations:
The SIM-FRET workflow is depicted in Fig. 1(b). Overall, two steps are required for implementing SIM-FRET: (1) reconstructing respectively three SR images using the structured illuminating raw image stacks from the three FRET channels (, , and ) and (2) quantitative calculation of the FRET efficiency () and the concentration ratio of total acceptor to donor () from reconstructed SR images via a three-channel post-processing process, including background subtraction and co-localization mask filtering.
3. RESULTS
A. SIM-FRET Imaging of Simulation FRET Models
To demonstrate the feasibility of our method and its fidelity in quantitative FRET analysis, we first conducted a simulation using SIM-FRET and compared the results with those of conventional WF-FRET as shown in Fig. 2(a). In the simulation, the ground truth is a synthetic star-like pattern composed of two alternately embedded predetermined FRET efficiencies ( and . The ground truth images of the three channels were obtained using a simulation model of spectral crosstalk, where the intensity of the AA channel and , were preassumed as inputs. The crosstalk coefficients were assumed to be , , , , , and . The simulated three-channel FRET raw image stacks are generated by a forward imaging model according to Eq. (1). The forward imaging model contained sinusoidal pattern illuminating and PSF blurring in the image formation process. The pixel size used for the simulation was 6.5 μm. The assumed emission wavelengths were 525 nm for the DD channel and 600 nm for the DA and AA channels, and the numerical aperture (NA) was 1.49. The assumed SIM frequency was 0.285 (per pixel). To visually demonstrate the concept of SIM-FRET for resolving fine structures in diffraction-limited regions, we did not add noise in our simulation, which avoided the histogram broadening in FRET quantitative analysis. The conventional WF-FRET images were obtained by averaging multiple simulated three-channel FRET raw image stacks. Figure 2(b) shows the FRET efficiency pseudo-color map of ground truth, WF-FRET, and SIM-FRET, respectively. Compared to the ground truth, WF-FRET is unable to distinguish the two adjacent FRET signals on the intricate structure of the simulation model due to the diffraction limit, while SIM-FRET is capable of resolving the difference between the two FRET signals across sub-diffraction areas. Further, the quantitative analysis results showed that the FRET efficiency measured by SIM-FRET was a good match with the ground truth values in Figs. 2(c) and 2(d), while the WF-FRET imaging distorted the FRET efficiency on the intricate structure due to the blur effects owing to the diffraction limit.
Figure 2.Simulative results demonstrate the resolution enhancement and quantitative fidelity of SIM-FRET. (a) Top panel, three-channel super-resolution images of simulation FRET models; bottom panel, corresponding pseudo-color map of FRET efficiency. (b) FRET efficiency images of ground truth, WF-FRET, and SIM-FRET, respectively. (c) Corresponding histograms of (b). (d) Intensity profiles along the white solid lines in (b). Scale bar: 50 pixels.
To assess the capability of SIM-FRET in live cells, we first developed an outer mitochondrial membrane (OMM) targeted FRET-standard construct ActA-G17M to create a live-cell FRET experiment with predetermined and values ( and ) on the intricate structure. ActA-G17M was consisting of FRET-standard construct GFP-17AA-mCherry fused to a mitochondria-specific Act-A tail-anchor sequence, where GFP (donor) and mCherry (acceptor) are separated with a 17 amino acid linker sequence. A reconstructed SR image of ActA-G17M expressed in MCF7 cells demonstrates fine mitochondrial localization [Fig. 3(a)]. Also, using the decorrelation analysis [32] indicates that the lateral resolution of the OMM structure in the acceptor channel was up to 120 nm [Fig. 3(b)]. The adjacent OMM structures, which were indistinguishable in the WF image, are resolved in the SR images (sparrow criteria) [Fig. 3(c)].
Figure 3.Resolution enhancement of SIM-FRET. (a) channel SR-SIM and WF images of outer mitochondrial membrane (OMM) targeted FRET-standard construct ActA-G17M. (b) Decorrelation analysis results corresponding to channel SR-SIM and WF images. (c) Intensity profiles of the yellow and blue solid lines in the close-up views in (a). Scale bars: 2 μm.
Next, to verify the performance of suppressing spurious FRET signals caused by noise artifacts, we implemented quantitative SIM-FRET imaging for living MCF7 cells expressing the ActA-G17M construct. To obtain the optimal trade-off between sampling speed and photon count, the exposure time of each image was 20 ms, and a complete SIM-FRET measurement took about 0.5 s. From reconstructed SIM-FRET three-channel images, we calculated the corresponding pseudo-color images of and when with or without co-localization mask filtering (Fig. 4), respectively. In the absence of co-localization mask filtering, OMM-targeted FRET signals were overwhelmed by spurious FRET signals from reconstruction artifacts and background [Figs. 4(a) and 4(b) lower left panels], and the corresponding green histogram showed messy or distorted results compared with reference and values ( and ) [Figs. 4(c) and 4(d)]. In contrast, with the co-localization mask filtering based on a strong correlation of donor and acceptor [Figs. 5(a) and 5(b)], OMM-targeted FRET signals were finely distinguished [Figs. 4(a) and 4(b) upper right panels] and the corresponding blue histogram results approach the reference and [Figs. 4(c) and 4(d)].
Figure 4.Performance of the co-localization mask filtering algorithm in SIM-FRET measurement. (a), (b) Pseudo-color images of and of OMM-targeted FRET-standard construct ActA-G17M when using (upper right) or not using (lower left) co-localization mask filtering. (c), (d) Corresponding histograms of (a), (b). Scale bars: 2 μm.
Figure 5.Validation of the performance of the co-localization mask in FRET-standard construct ActA-G17M samples. (a) channel (green), channel (red), and the merge channels’ intensity images and two-dimensional fluorescence histograms of ActA-G17M in the absence of mask filtering. (b) Comparatively, results of co-localization mask filtering. Scale bars: 2 μm.
On the other hand, we considered that mask filtering may artificially construct spatial structures to yield false SR FRET results. To visually demonstrate that SIM-FRET resolves FRET on fine structures by increasing spatial resolution rather than mask filtering, we compared the results of SIM-FRET shown in Fig. 4(a) with the WF-FRET results in the same field of view (Fig. 6). In the absence of co-localization mask filtering, the SIM-FRET reconstructed intensity image and pseudo-color image still show clear OMM structures [Figs. 6(a) and 6(b), right]; the WF-FRET results have less noise and background, but the fine OMM structures cannot be resolved [Figs. 6(a) and 6(b), left]. In addition, the spatial distribution of filtering FRET results for strong donor–acceptor correlations is in good agreement with the fine OMM structure intensity distribution [Figs. 6(c) and 6(d)]. The above analysis demonstrated that SIM-FRET enhances the resolution of FRET by increasing the lateral resolution rather than SR masking.
Figure 6.FRET mapping result comparison between raw and co-localization mask filtered data. (a) channel WF (left) and SIM (right) intensity images of ActA-G17M. (b) Pseudo-color images of WF (left) and SIM (right) using raw three-channel images. (c) Pseudo-color images of WF (left) and SIM (right) when using co-localization mask filtering. (d) Merge of intensity and map images. Scale bar: μ.
Finally, we demonstrated the quantitative imaging effect of SIM-FRET and compared its performance with conventional WF-FRET. Figure 7(a) shows the representative three-channel intensity images of ActA-G17M, where SR-SIM significantly improved the lateral resolution. From the corresponding co-localization mask filtered pixel-to-pixel pseudo-color images of and [Figs. 7(b) and 7(c)], we found that the SIM-FRET revealed more accurate regions of the predetermined OMM-targeted FRET signals, while the conventional WF-FRET imaging distorted these signals. The histograms of and corresponding to FRET signals in Figs. 7(b) and 7(c) showed that SIM-FRET maintained the quantitative analysis capability just as WF-FRET without additional corrections [Fig. 7(d)]. We additionally tested the FRET efficiency of plasmid G17M with the FLIM method (Fig. 8). The statistical and values of SIM-FRET were consistent with WF and FLIM measurement, further demonstrating the accuracy of our method [Figs. 7(e) and 8(e)].
Figure 7.Performance of quantitative SR SIM-FRET measurement in live cells. (a) Three-channel intensity WF (top) and SR-SIM (bottom) images of ActA-G17M. (b), (c) Corresponding pseudo-color images and of the sample in (a). (d) Top panel, histograms of in (b); bottom panel, histograms of in (c). (e) Top panel, comparison of the statistical values of SIM-FRET and WF-FRET; bottom panel, comparison of the statistical values of SIM-FRET and WF-FRET. (f) Close-up view of the blue-boxed region in (a). (g) Close-up view of the yellow-boxed region in (b). (h) Intensity profiles along the blue lines in (f). (i) profiles along the yellow lines in (g). Scale bars: 2 μm.
Figure 8.Typical FLIM measurement of FRET construct G17M samples. (a) Intensity image of G17M. (b) Pseudo-color images FRET efficiency of G17M. (c) Distribution of photons over time for a typical FLIM measurement on G17M. The exponential function fit (blue line) was convolved with the IRF (red line). (d) Histograms of in (b). (e) Comparison of the statistical values of WF -FRET and FLIM-FRET. Scale bars: 8 μm.
A recent study indicated that fission position on a mitochondrion is a key morphological signature that determines mitochondrial proliferation or degeneration. The fine morphological and biochemical changes before and after fission via live cells are crucial for exploring molecular mechanisms that lead to different mitochondrial fates [33]. SIM-FRET provides a convenient tool to study morphological changes and the corresponding molecular behavior in the intricate structure of organelles. Two mitochondria fission sites [white arrows in Figs. 7(f) and 7(g)], which were unable to be resolved in the WF-FRET images, are clearly distinguished in SIM-FRET images. As shown in the section analyzing the profiles in Figs. 7(h) and 7(i), SIM-FRET images exhibit the SR signature and the corresponding FRET construct, further demonstrating the feasibility of our method to study quantitative SR FRET.
4. DISCUSSION
In this work, we present a quantitative live-cell SR FRET imaging method based on structured illumination microscopy (SIM-FRET), which enhances the resolution of conventional FRET to resolve molecular behavior localized in intricate biological structures. By combining SR-SIM imaging and quantitative sensitized emission FRET imaging, SIM-FRET for the first time, to the best of our knowledge, provides SR quantitative FRET images with 120 nm resolution for living cells expressing a FRET construct targeting mitochondria. Moreover, the SIM-FRET image exhibits an SR morphological signature and the corresponding signal of the FRET construct on the mitochondrial fission sites, demonstrating the feasibility of SIM-FRET to investigate the spatiotemporal distribution and functional state of molecules in live-cell sub-diffraction regions.
As the extension of resolution in SR FRET methods requires an increase in photons, achieving quantitative SR FRET in living cells is considered a challenging and elusive task [12,23]. A recent study showed that acceptor sensitized emission FRET imaging has a competitive edge in terms of photon efficiency [34]. Thus, combining SR-SIM imaging and quantitative sensitized emission FRET imaging may offer an optimal balance between photon dosage and spatial resolution. Compared to other SR FRET methods, SIM-FRET is compatible with the most commonly used fluorescent protein FRET pairs in conventional live-cell FRET imaging. Importantly, the advantage of SIM and sensitized emission FRET in photon efficiency allows SIM-FRET to achieve quantitative FRET analysis using a low photon budget, which substantially extends the biophysical information (such as stoichiometry of molecular complexes or the kinetics and affinities of molecular interactions) extracted from live-cell SR FRET imaging.
The SIM reconstruction procedure involves the redistribution of image intensity, inappropriate parameter tuning, and nonlinearly iterative deconvolution, which may impair the fidelity of the reconstructed SR images and the reliability of quantitative FRET analysis. Linear Wiener reconstruction seems to perform effectively in maintaining fluorescence intensity fidelity, since the pipelines involving frequency decomposition, shifts, and OTF compensation are linear. We evaluated the quantitative analysis fidelity of SIM-FRET reconstructed signals in both simulation FRET models and live-cell FRET-standard construct samples. Quantitative FRET results based on the linear Wiener reconstruction approach showed reliable consistency with reference, which is proved in our SIM-FRET imaging for the cells expressing construct ActA-G17M (Fig. 7). This may provide a reference frame for other applications of quantitative analysis based on SR-SIM intensity values.
Live-cell SIM-FRET imaging must pay much attention to some conditions. Very low FRET efficiency may lead to the fact that the number of photons collected in the FRET sensitization channel () is insufficient to complete SR-SIM reconstruction. Therefore, SIM-FRET may be unable to perform an accurate quantitative FRET analysis, and in this case, WF-FRET exhibits higher robustness due to its nonreliance on image reconstruction. Another practical limitation is that SIM-FRET may produce more false positive FRET signals when processing samples with a strong out-of-focus background. We use prior knowledge of the strong correlation of donor–acceptor distributions in the occurrence of FRET to suppress the interference of false positive FRET signals caused by random noise artifacts. However, the correlation of donor–acceptor distributions cannot effectively distinguish between structural artifacts caused by out-of-focus background and the genuine signal since such artifacts between and channels are relatively stable. Therefore, designing and establishing integral SIM-FRET forward model-based algorithms to better address reconstruction from low-signal-to-noise ratio and high out-of-focus background images will be our future work.
Overall, SIM-FRET enables quantitative live-cell SR FRET analysis and provides unprecedented SR morphological signature and the corresponding FRET signal. We anticipate that in the future, more fast imaging systems and more robust reconstruction algorithms could be combined to assist in studying long-term dynamic interactions between intracellular molecules in intricate biological structures.
Acknowledgment
Acknowledgment. We thank Prof. Ming Lei and Dr. Tianyu Zhao at Xi’an Jiaotong University for assistance in SIM. We also thank Dr. Weijing Han and Ye Yuan for FLIM measurements and data acquisition.
APPENDIX A: DETAILS OF SAMPLE PREPARATIONS
Constructs
EGFP (#74165) and mCherry (#176016) plasmids were obtained from Addgene (Cambridge, MA, USA). Plasmid of mCherry-ActA was kindly provided by David W. Andrews.
The G17M clone was generated by amplifying the full-length mCherry cDNA and inserting oligo 5’TCCGGACTCAGATCTCGAGCTCAAGCTTCGAATTCTGCAGTCGACGGTACC-3’ before mCherry start codon (ATG). The insert was cloned into the GFP C3 vector to make G17M.
To generate a plasmid encoding GFP fused to ActA, the coding region for ActA was prepared by PCR from the ActA cDNA of mCherry-ActA and replaced the Bak coding region from the plasmid encoding GFP-Bak. The ActA-G17M construct was prepared in the G17M by replacing the stop codon with the cloning region of ActA.
Cell Culture and Transfection
MCF-7 cell line purchased from National Collection of Authenticated Cell Cultures (Shanghai, China) was cultured in Dulbecco’s Modified Eagle’s Medium (DMEM, Gibco, Grand Island, USA) supplemented with 10% fetal bovine serum (FBS, Gibco, USA) and 1% gentamicin-amphotericin B mixed solution (Leagene, Beijing, China) in a humidified incubator with 5% CO2 at 37°C. For transfection, cells were seeded in a 20 mm glass dish and cultured 10–12 h in DMEM containing 10% FEB. When the cell reached 50%–60% confluence, plasmids were transfected into the cells for 24 h using TurbofectTM in vitro transfection reagent (Fermentas Inc., Glen Burnie, MD, USA) according to the manufacturer’s standard protocol.
System Calibration
We used living MCF7 cells separately expressing GFP and mCherry to measure the spectral crosstalk coefficients: , , , and . The system calibration factors (G and factors) are measured by implementing the mPb-G [29] method with G17M and G32M; the statistical results from at least 20 living cells were (), (), (), (), G (), and (), respectively.