• Photonics Research
  • Vol. 8, Issue 4, 595 (2020)
Qiuhui Chu1、2, Qiang Shu1, Zeng Chen3, Fengyun Li1, Donglin Yan1, Chao Guo1, Honghuan Lin1, Jianjun Wang1, Feng Jing1, Chuanxiang Tang2, and Rumao Tao1、*
Author Affiliations
  • 1Research Center of Laser Fusion, China Academy of Engineering Physics, Mianyang 621900, China
  • 2Key Laboratory of Particle & Radiation Imaging (Tsinghua University), Ministry of Education, Department of Engineering Physics, Tsinghua University, Beijing 100084, China
  • 3National Key Laboratory of Science and Technology on Blind Signal Processing, Chengdu 610000, China
  • show less
    DOI: 10.1364/PRJ.383551 Cite this Article Set citation alerts
    Qiuhui Chu, Qiang Shu, Zeng Chen, Fengyun Li, Donglin Yan, Chao Guo, Honghuan Lin, Jianjun Wang, Feng Jing, Chuanxiang Tang, Rumao Tao. Experimental study of mode distortion induced by stimulated Raman scattering in high-power fiber amplifiers[J]. Photonics Research, 2020, 8(4): 595 Copy Citation Text show less
    Experiment setup of the laser system.
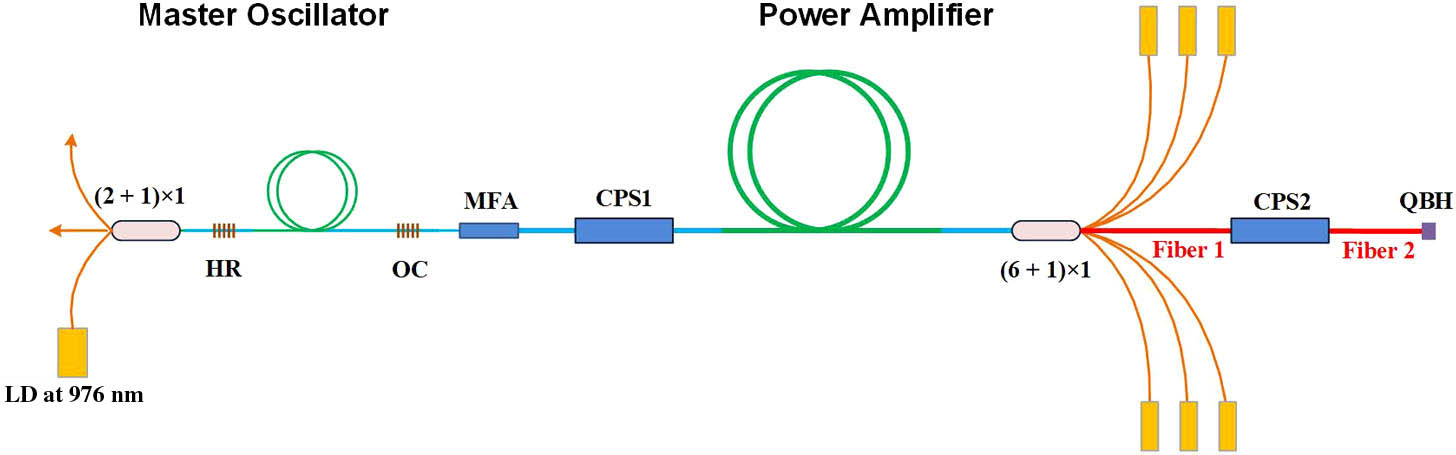
    Fig. 1. Experiment setup of the laser system.
    (a) Output power of the laser as a function of pump power. (b) Spectra at different output powers.
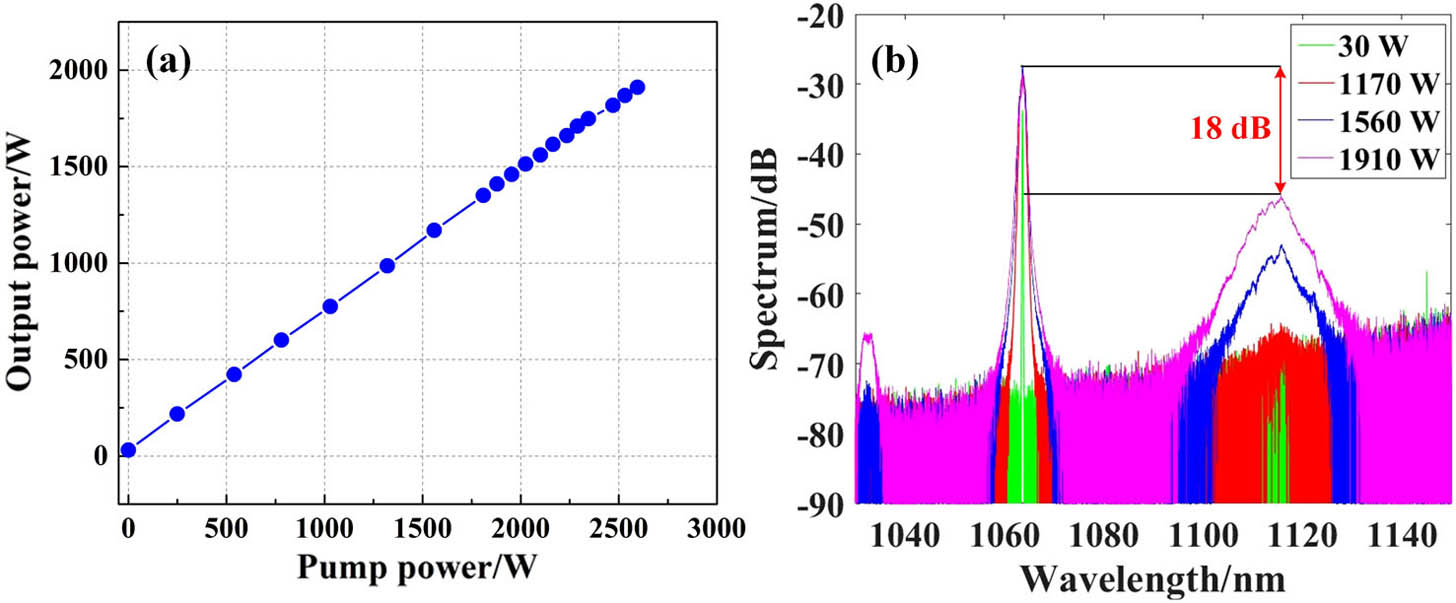
    Fig. 2. (a) Output power of the laser as a function of pump power. (b) Spectra at different output powers.
    (a) Beam quality and the ratio of Raman Stokes light. (b) Ratio of IM-FWM light of the laser at different output powers.
    Fig. 3. (a) Beam quality and the ratio of Raman Stokes light. (b) Ratio of IM-FWM light of the laser at different output powers.
    Temperature of passive fiber of the laser at different output powers.
    Fig. 4. Temperature of passive fiber of the laser at different output powers.
    Near-field intensity distributions captured from camera at (a) 1560 W (Visualization 1) and (b) 1910 W (Visualization 2).
    Fig. 5. Near-field intensity distributions captured from camera at (a) 1560 W (Visualization 1) and (b) 1910 W (Visualization 2).
    Time traces of the laser with (a) 50 s period and (b) 100 μs period at different output powers.
    Fig. 6. Time traces of the laser with (a) 50 s period and (b) 100 μs period at different output powers.
    FS of low-frequency time traces with 50 s period.
    Fig. 7. FS of low-frequency time traces with 50 s period.
    Character factor σ as a function of output laser power.
    Fig. 8. Character factor σ as a function of output laser power.
    (a) Output power versus pump power. (b) Beam quality of the laser with bent passive fiber.
    Fig. 9. (a) Output power versus pump power. (b) Beam quality of the laser with bent passive fiber.
    Near-field intensity distributions at several output powers.
    Fig. 10. Near-field intensity distributions at several output powers.
    Phase-matching diagrams of the IM-FWM for the 26/400 fiber.
    Fig. 11. Phase-matching diagrams of the IM-FWM for the 26/400 fiber.
    Qiuhui Chu, Qiang Shu, Zeng Chen, Fengyun Li, Donglin Yan, Chao Guo, Honghuan Lin, Jianjun Wang, Feng Jing, Chuanxiang Tang, Rumao Tao. Experimental study of mode distortion induced by stimulated Raman scattering in high-power fiber amplifiers[J]. Photonics Research, 2020, 8(4): 595
    Download Citation