• Spectroscopy and Spectral Analysis
  • Vol. 41, Issue 11, 3639 (2021)
Li PING1、*, Rong ZHAO1、1;, Bin YANG1、1; *;, Yang YANG1、1;, Xiao-long CHEN2、2;, and Ying WANG1、1;
Author Affiliations
  • 11. School of Energy and Power Engineering/Shanghai Key Laboratory of Multiphase Flow and Heat Transfer in Power Engineering, University of Shanghai for Science and Technology, Shanghai 200093, China
  • 22. Shanghai Space Propulsion Technology Research Institute, Shanghai 201109, China
  • show less
    DOI: 10.3964/j.issn.1000-0593(2021)11-3639-09 Cite this Article
    Li PING, Rong ZHAO, Bin YANG, Yang YANG, Xiao-long CHEN, Ying WANG. Inversion of Particle Size Distribution in Spectral Extinction Measurements Using PCA and BP Neural Network Algorithm[J]. Spectroscopy and Spectral Analysis, 2021, 41(11): 3639 Copy Citation Text show less
    Schematic diagram of extinction measurement principle
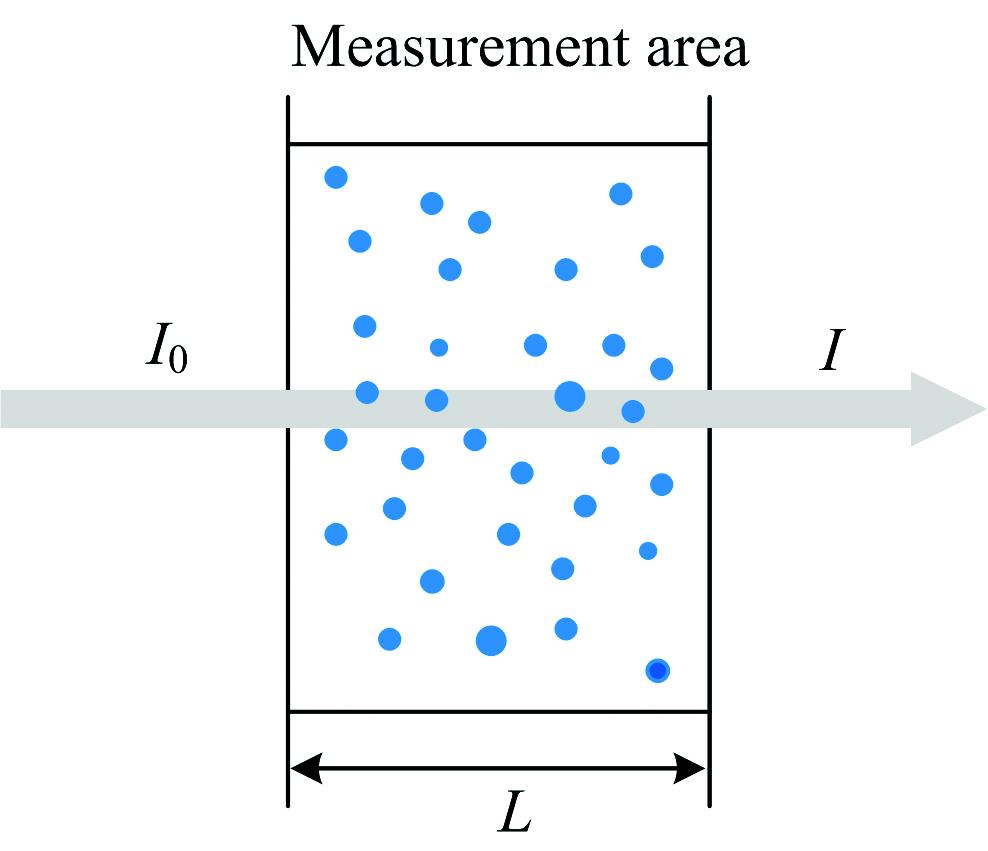
    Fig. 1. Schematic diagram of extinction measurement principle
    BP Neural network model
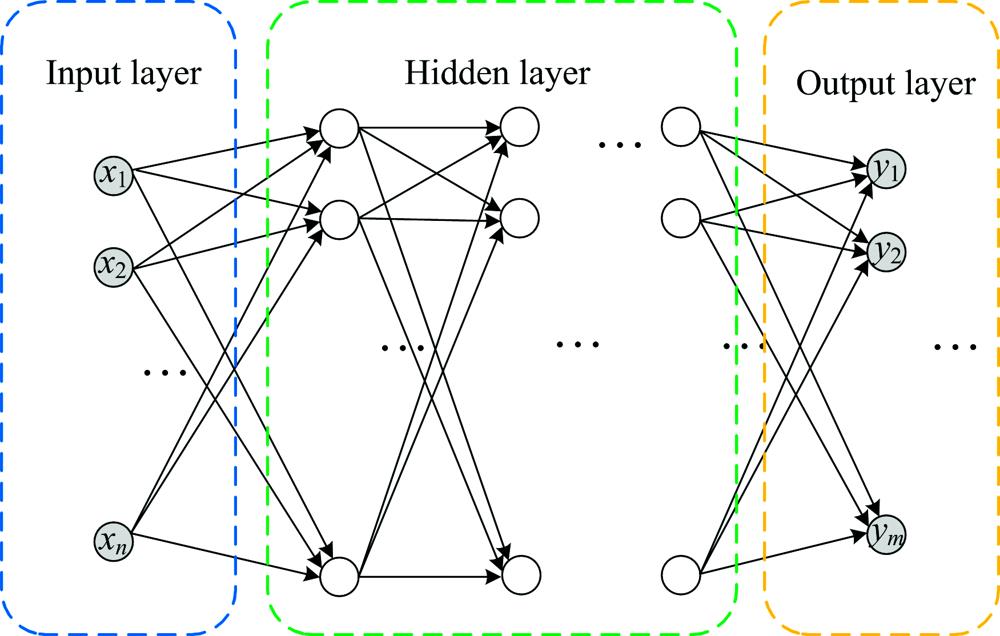
    Fig. 2. BP Neural network model
    Distribution of extinction values with particle size and wavelength
    Fig. 3. Distribution of extinction values with particle size and wavelength
    The correlation coefficient matrix of spectral extinction value
    Fig. 4. The correlation coefficient matrix of spectral extinction value
    The distribution of the comprehensive load coefficient with the wavelength
    Fig. 5. The distribution of the comprehensive load coefficient with the wavelength
    Influence of the number of wavelengths on the estimation accuracy of the neural network(a): BP neural network; (b): PCA-BP neural network
    Fig. 6. Influence of the number of wavelengths on the estimation accuracy of the neural network
    (a): BP neural network; (b): PCA-BP neural network
    Experimental system for PSD measurement by spectral extinction method
    Fig. 7. Experimental system for PSD measurement by spectral extinction method
    Prediction results of PSD(a): 500 nm; (b): 700 nm; (c): 900 nm;(d): 2.1 μm; (e): 5.1 μm; (f): 9.7 μm
    Fig. 8. Prediction results of PSD
    (a): 500 nm; (b): 700 nm; (c): 900 nm;(d): 2.1 μm; (e): 5.1 μm; (f): 9.7 μm
    Desired
    value
    /μm
    BP neural networkPCA-BP neural network
    Output
    value/μm
    Relative
    error/%
    Output
    value/μm
    Relative
    error/%
    0.500.3333.650.524.38
    1.501.638.381.481.06
    2.502.614.062.452.03
    3.503.325.233.354.29
    4.504.510.234.530.58
    5.505.323.215.825.83
    6.506.224.346.411.39
    7.507.253.377.312.59
    8.508.411.168.480.17
    9.509.420.889.520.23
    Table 1. Prediction results of different particle sizes
    Desired
    value
    BP neural networkPCA-BP neural network
    Output
    value
    Relative
    error/%
    Output
    value
    Relative
    error/%
    21.2438.002.199.50
    43.5311.754.061.69
    65.616.55.823.09
    88.121.57.674.06
    109.841.69.910.87
    Table 2. Predictionresults of different distributed parameters
    Li PING, Rong ZHAO, Bin YANG, Yang YANG, Xiao-long CHEN, Ying WANG. Inversion of Particle Size Distribution in Spectral Extinction Measurements Using PCA and BP Neural Network Algorithm[J]. Spectroscopy and Spectral Analysis, 2021, 41(11): 3639
    Download Citation