
Li PING, Rong ZHAO, Bin YANG, Yang YANG, Xiao-long CHEN, Ying WANG. Inversion of Particle Size Distribution in Spectral Extinction Measurements Using PCA and BP Neural Network Algorithm[J]. Spectroscopy and Spectral Analysis, 2021, 41(11): 3639
- Spectroscopy and Spectral Analysis
- Vol. 41, Issue 11, 3639 (2021)
Abstract
Keywords
Introduction
PSD is an important evaluation index in industrial production, energy utilization, environmental monitoring and other fields. The non-intrusive optical measurement plays a key role in PSD measurement[
In spectral extinction measurement, the light beam passes through the area to be measured containing particles. Due to scattering and absorption of particles, the intensity of transmitted light passing through the measuring area is attenuated. The attenuation degree of transmitted light at different wavelengths is related to particle size, quantity and refractive index of particles[
Compared with traditional algorithms, intelligent algorithms have better global search capability and anti-noise capability. However, some algorithms still have slow evolution speed and long calculation time, which is not conducive to the development of online measurement technology of particle size parameters[
Therefore, this paper proposesa spectral extinction particle size analysis method based on the PCA-BP neural network. Through the change of the principal component of the spectral data, the load coefficient of each wavelength on the principal component of the spectral data is analyzed. Then the wavelength containing more information is selected to realize the dimensionality reduction of spectral data. Based on Mie scattering theory, the spectral extinction values at different particle sizes and wavelengths are simulated and calculated, and they are used as spectral extinction samples for multi-layer feed forward artificial neural network training of error reverse propagation. After repeated learning and training, the network parameters corresponding to the minimum error are determined, and the particle size parameters of the spectral extinction method are predicted by using the network, which can realize fast and accurate calculation of PSD. Therefore, an experimental system for particle size measurement by spectral extinction method was set up, and standard polystyrene particles with particle sizes ranging from 0.5~9.7 μm were measured.
1 The principle of PSD inversion
1.1 Spectral extinction theory
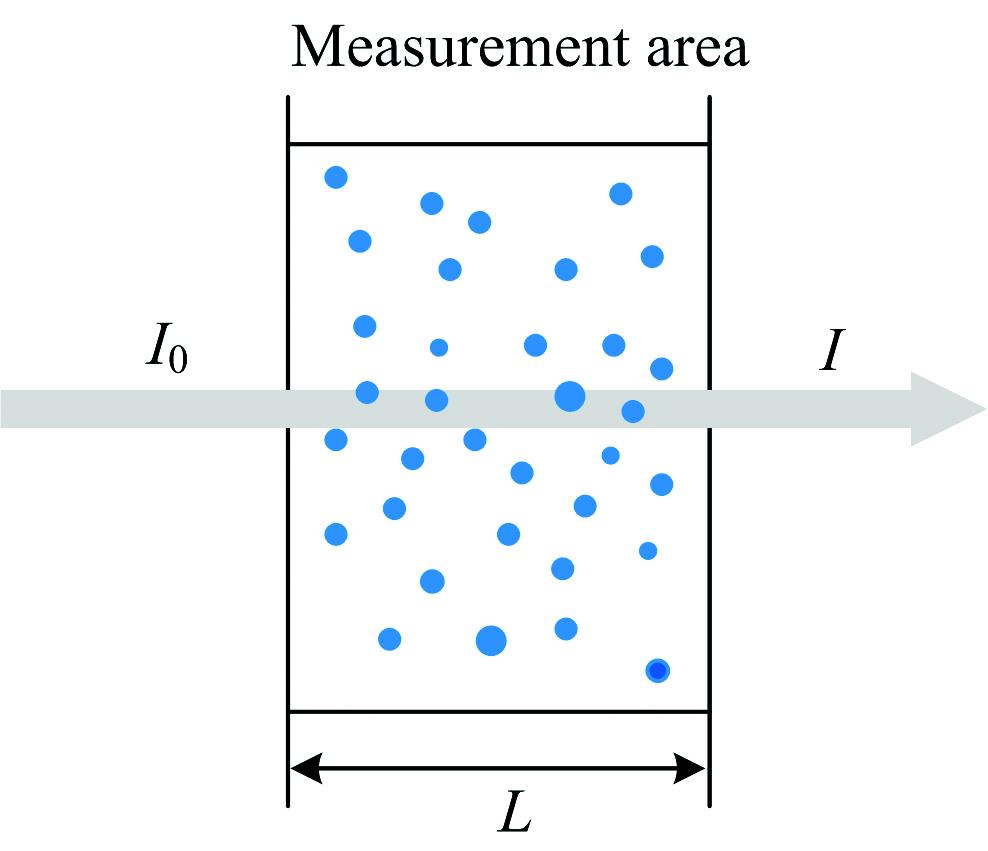
The basic principle of measuring PSD by spectral extinction method follows Lambert-Beer law. As shown in Fig.1, when a beam of parallel incident light I0 passes through a measurement area containing uniform suspended particles, the transmitted light intensity Iwould be attenuated to a certain extent due to the scattering and absorption of the particles, and the attenuation degree is related to the particle size and concentration. If m the particle to be tested is a poly-disperse system composed of individual particles with a number of N, its extinction value is
![]()
Figure 1.Schematic diagram of extinction measurement principle
where (I/I0
The particle distribution model adopted in this paper is Rosin-Rammler distribution, and the distribution function can be expressed as follows
where
1.2 Artificial neural network algorithm
The artificial neural network uses the interaction of neurons to complete information processing, including forwarding propagation of data signals and back-propagation of errors. The input layer reaches the output layer through one or more hidden layers, and the weightcoefficients and offset coefficient in the network is continuouslyadjusted according to the error between the output layer value and the target value to realize theiteration of the algorithm. The BP neural network model is shown in Figure 2.
![]()
Figure 2.BP Neural network model
In the process of PSD analysisbased on neural networks, spectral extinction data, as the input layer variable of the neural networks, has a great impact on the accuracy of network training results and the complexity of network training. Less spectral dimension would lead to the loss of important information in extinction signals, which results in lower accuracy of the trained network. Too many spectral dimensions would cause input variables to contain more redundant information, making the network more complex and increasing the difficulty of training.
1.3 PSD inversion algorithm based on PCA-BP neural network
This paper proposes a PSD inversion algorithm combining PCA and BP neural network based on artificial neural network. Based on the principle of PCA, the algorithm analyzes theextinction values at different wavelengths and constructs principal components. The comprehensive load coefficient is defined as an index to evaluate the total mapping information of each wavelength in the principal component. Therefore, redundant wavelengthsare eliminated,the optimal characteristic wavelength of the spectrum is selected, and the dimension reduction of spectral extinction datais realized.
Spectral extinction values ase used as input data sets for PCA
where xi,j denotes the spectral extinction value at the particle size grade of i and the wavelength of j, p is the number of particle size grades, and M is the number of wavelengths. The standardized matrix of data set X can be calculated as
where μ and σ are the standard deviation vector and mean vector of the original data set X respectively, which can be expressed as
The correlation coefficient between each wavelength vector of the standardized matrix can be calculated as follows
where ρa,b is the correlation coefficient of the standardized spectral extinction data at wavelength a and b, and the correlation coefficient matrix R can be obtained
By solving the eigenroot γ1, γ2, …, γM of the correlation coefficient matrix R and the corresponding eigenvector T1, T2, …, TM, the principal component F can be calculated by multiplying the eigenvector and the standardized matrix.
Since the principal component is a linear representation of each eigenvector, there is no correlation between each principal component. When the cumulative contribution rate of the current N principal components is greater than 99%, the first N unrelated principal components carry more than 99% of the information of the original data.
Each element tj,m (m=1, 2, 3, …, M) in the eigenvector Tj corresponding to principal component Fj is the load coefficient of Fj at each wavelength, and the magnitude of tj,m reflects how much spectral information is mapped to the j-thprincipal component at the i-th wavelength. A larger load coefficient indicates that the spectral information of this wavelength occupies a larger weight in the principal component. Although the first N principal components contain most of the information of the original spectral data, they change the physical meaning of the spectral extinction value. The load coefficient tj,m can retain the original data’s physical meaning and eliminate the redundant information in the spectral data to the greatest extent. Therefore, the load coefficient is used as the main basis for wavelength selection in this paper.
According to the load coefficient tj,m and eigenvector γj of each principal component, the comprehensive load coefficient vj is defined, as shown in Equation (6). vj reflects the total mapping information of each wavelength in the first N principal components with a higher contribution rate. The wavelength corresponding to the larger comprehensive load coefficient is selected as the optimal characteristic wavelength after spectral data dimension reduction.
The extinction value (x1, x2, …, xn) of the optimal characteristic wavelength after dimension reduction is taken as the input layer and sent to the BP neural network. The neuron model of the first hidden layer can be expressed as follows
where xj is the extinction value at the j-th wavelength, wi,j represents the weight coefficient corresponding to the i-th neuron unit, bi is the bias threshold of the neuron unit, n is the wavelength number of the spectral data after dimension reduction, k is the number of neurons in this layer, and ui is the sum of the linear combination of neuron input signals and the bias threshold.
In the neural network, the excitation function ϕ(u) is needed to express the nonlinear function of the network. The excitation function used in this paper is the sigmoid function
Take ϕ(u) as the output value of the neurons in this layer and send it to the next layer of the neural network until the output layer outputs (y1, y2, …, ym), to realize feed-forward propagation of data in the BP neural network.
2 Numerical simulation results and discussion
2.1 Simulation data training
Since the range of particle size measurement by spectral extinction method is mainly 0.1~10 μm[
![]()
Figure 3.Distribution of extinction values with particle size and wavelength
According to the data set of spectral extinction values obtained by simulation, 100 wavelengths are selected in the wavelength range of 400~900 nm, and 100 particle sizesare selected in the particle size range of 0.1~10 μm. The corresponding extinction values are used as the original data for PCA. After standardizing the original extinction value data, the correlation coefficient of each wavelength vector is calculated to obtain the correlation coefficient matrix as shown in Fig.4. It can be seen that the correlation coefficients between adjacent wavelengths are relatively close, and the distribution of correlation coefficient with wavelengths has a certain periodicity. However, the discrimination degree between the correlation coefficients of extinction value is relatively fuzzy, and the representative wavelength cannot be directly obtained, so the correlation coefficient matrix needs to be further analyzed.
![]()
Figure 4.The correlation coefficient matrix of spectral extinction value
The principal component of the extinction data can be obtained by solving the eigen root and eigenvector of the correlation coefficient matrix. Each principal component is a linear combination of each wavelength vector and is independent of each other. Among them, the contribution rates of the first three principal components are 60.13%, 38.36% and 0.76% respectively, and the cumulative contribution rates are 60.13%, 98.49% and 99.25% respectively. Thus, the first three principal components already contain most of the information in the spectral data. The comprehensive load coefficients of each wavelength for the first three principal components are analyzed, as shown in Fig.5. It can be seen that the load coefficients of each wavelength are obviously distinguished. The larger the load coefficients corresponding to the wavelength are, the more mapping information the wavelength has in the principal components and ismore representative. The wavelength with larger comprehensive load coefficients is taken as the optimal characteristic wavelength to realize the dimension reduction of spectral data.
![]()
Figure 5.The distribution of the comprehensive load coefficient with the wavelength
When 100 feature size parameters
2.2 Comparison between PCA-BP neural network and BP neural network
The selection method and number of wavelengths greatly influence the training the efficiency of neural network model and the accuracy of predicted values. The traditional spectral extinction particle size measurement based on BP neural network mainly adopts random selection method and uniform selection method of the whole band in wavelength selection. In order to compare the prediction results of the two network models, this paper adopts the wavelength selection methods of random selection and feature optimal selection respectively, calculates the corresponding extinction value data according to the selected bands, uses them to train the neural network model, and analyzes the prediction accuracy of the neural network model.
The traditional BP neural network and PCA-BP neural network are used to compare the prediction results of different feature size parameters and distribution parameters respectively. As shown in Table 1, PCA-BP neural network has a higher prediction accuracy than the traditional BP neural networkfor the prediction results of characteristic size parameters of particle system distribution. The average relative error of the feature size parameters predicted by BP neural network model is 6.45%, while the average relative error of predicted by PCA-BP neural network model is only 2.25%.
Table 2 shows the prediction results of distribution parameters. It can be seen that the prediction accuracy of PCA-BP network model for distributed parameters is also significantly higher than that of BP neural network, and the average relative error decreases from 11.87% to 3.84%. Especially for particles with small distribution parameters, the PCA-BP neural network has obvious advantages. The distribution of the particle systems is relatively dispersed, and the proportion of the number of particles with different particle sizes is relatively uniform due to the overlapping extinction effects of particles with different particle sizes on various wave bands, the prediction difficulty increases. By selecting the optimal characteristic wavelength, the information of spectral extinction data can be obtained to the greatest extent, and the trained PCA-BP neural network model also has higher prediction accuracy.
The number of wavelengths has a certain effect on the prediction accuracy of network models. By setting different wavelength numbers, the BP neural network and PCA-BP neural network are trained respectively using extinction value data. The expected values of different distribution parameters are predicted to calculate the average relative error of network output values. The results are shown in Figure 6.
![]()
Figure 6.Influence of the number of wavelengths on the estimation accuracy of the neural network
(a): BP neural network; (b): PCA-BP neural network
The prediction accuracy of the two network models increases with the rise of the number of wavelength selections, while there is a threshold of wavelength selection number. After the threshold is exceeded, the inversion accuracy does not improve significantly. When training the network, if the number of wavelengths is too small, the prediction results will have large errors; if the number is too much, although the reliability of the network can be improved, the spectral data processing capacity will increase, and the running time of the computer will become longer. The threshold value of wavelength selection number should be adopted, which can ensure the measurement accuracy and improve the calculation speed and is conducive to realize the real-time online measurement of particle size.
The wavelength selection threshold of the BP neural network is about 25. When the number of wavelength selections exceeds 25, the reduction of relative error is no longer obvious. However, the threshold value of the PA-BP neural network is around 7, indicating that the PCA-BP neural network can train a network model with higher prediction accuracy with fewer wavelength numbers. It can greatly improve the training efficiency of the network and provide better technical support for the field of online measurement which is limited by the number of wavelengths.
3 Experimental results and discussion
3.1 Experiment system
A PSD measurement systemis built based on the principle ofparticle size measurement by spectral extinction method, as shown in Fig.7. The system consists of stabilized power supply, halogen light source, converging lens, diaphragm, cuvette, collimating lens, spectrometer and computer. The stabilized power supply is used to adjust the brightness of the halogen light source. After the light beam emitted by the halogen light source is converged by the converging lens, it passes through the diaphragm to control the width of the light beam, to ensure that the light beam in the measured area is parallel light with higher intensity. The light beam passing through the measured area is received by the collimating lens and transmitted to the spectrometer to measure the light intensity attenuation information of the area to be measured. The spectrometer model is Ocean Optics HR-4000 optical fiber spectrometer, the light source is Philips G4 halogen light source, and the rated power is 20 W; The standard particles are 6 kinds of polystyrene standard particles with nominal particle sizes of 500 nm, 700 nm, 900 nm, 2.1 μm, 5.1 μm and 9.7 μm produced by Haian Hongmeng.
![]()
Figure 7.Experimental system for PSD measurement by spectral extinction method
3.2 Experimental results
The BP neural network model trained by the spectral extinction data, is used to carry out inversion prediction on the particle size parameters of the measured standard particles with six different particle sizes. The results are shown in Figure 8. The theoretical distributions curve is measured by laser diffraction PSD analyzer, and the prediction results of PCA-BP neural network and Nonlinear Least Squares (NLS) algorithm areanalyzed by spectral extinction measurement results. Both algorithms have high accuracy, while the error of the neural network prediction results is large for the prediction results of 9.7 μm, which is due to the large degree of oscillation of extinction value of each wavelength with the increase of particle size, causing certain error to the inversion of particle size. Moreover, the selected wavelength is mainly concentrated in 400~900 nm, and the transmission light signal difference is small for larger particles. However, the measurement error is still within 5%, indicating that this method still has good applicability for larger particles with a size close to 10 μm. Compared with the NLS algorithm, the PCA-BP neural network has higher prediction efficiency. After training, the network can output prediction results quickly and is more suitable for online measurement.
![]()
Figure 8.Prediction results of PSD
(a): 500 nm; (b): 700 nm; (c): 900 nm;(d): 2.1 μm; (e): 5.1 μm; (f): 9.7 μm
4 Conclusion
Aiming at the problems of complicated calculation and low inversion efficiency of spectral extinction particle size algorithm, a particle size analysis method based on PCA-BP neural network is proposed. Based on Mie scattering theory, the distribution of extinction value with wavelength of different particle sizes is theoretically calculated. The extinction data set of optimal characteristic wavelength is taken as sample data to train the neural network model, and the prediction results are compared with those of the traditional artificial neural network model. The algorithm is verified by experimental measurement, and the results show that:
(1) Based on the PCA, the correlation between each wavelength vector can be determined, and the extinction value corresponding to the optimal characteristic wavelength can be selected by using the comprehensive load coefficient, which has good representativeness for the overall spectral data and can realize the dimensionality reduction of spectral data.
(2) Compared with the traditional BP neural network model, the PSD analysis method based on the PCA-BP neural network model has higher prediction accuracy and has more obvious advantages in predicting the distribution parameters of the more dispersed particle systems. Moreover, the PCA-BP neural network model still has high prediction accuracy when the selected wavelengths are relatively small.
(3) An experimental measurement system for particle size parameters is established based on the measurement principle of the spectral extinction method. The spectral extinction values of 6 standard particles in the range of 0.5~9.7 μm are measured. The trained PCA-BP neural network model is used to predict the particle size parameters. The prediction results could be output instantaneously with an error of less than 5%, which verifies the algorithm’s feasibility.
References
[1] Xiao-shu CAI, Jian-qi SHEN, Ming-xu SU. Technology and Applications of Particle Size Measurement(2010).
[2] Hong QI, Liming RUAN, Shenggang WANG et al. Chinese Optics Letters, 6, 346(2008).
[3] S Barbosa, A Onofri F R, O Touré et al. Journal of Quantitative Spectroscopy & Radiative Transfer, 126, 160(2013).
[4] Xing HUANG. Doctoral Dissertation. Harbin Institute of Technology(2019).
[5] Xiao-shu CAI, Hao LIU, Wu ZHOU et al. Chinese Journal of Power Engineering, 35, 816(2015).
[6] Zhenzong He, Hong Qi, Yuchen Yao et al. Journal of Quantitative Spectroscopy and Radiative Transfer, 149, 117(2014).
[7] Li-xia CAO, Chen WANG, Biao ZHANG et al. Acta Optica Sinica, 39, 214(2019).
[8] Ke-wei PAN, Bin YANG, Rong ZHAO et al. Acta Optica Sinica, 40, 108(2020).
[9] Jun CHEN, Huinan YANG, Yi ZHOU et al. Results in Physics, 10, 22(2018).
[10] J Aguilar F, D Gale M, J Vargas-Ubera. Applied Optics, 46, 124(2007).
[11] N Riefler, T Wriedt. Particle & Particle Systems Characterization, 25, 216(2008).
[12] Xiaoshu CAI, Kuanfang REN, Feng XU et al. China Particuology, 2, 235(2004).
[13] Xiao-gang SUN, Li WANG. Spectroscopy and Spectral Analysis, 33, 618(2013).
[14] Qin Chen, Zhenzong HE, Hong QI et al. Particuology, 28, 6(2016).
[15] Shu LI, Chuan-long XU, Biao ZHANG et al. Journal of Central South University·Science and Technology, 47, 3922(2016).
[16] Li WANG. Doctoral Dissertation. Harbin Institute of Technology(2013).
[17] T Frette, M Li, D Wilkinson. Industrial & Engineering Chemistry Research, 40, 4615(2001).


Set citation alerts for the article
Please enter your email address

© Copyright 2018-2021 | Chinese Laser Press. All Rights Reserved 沪ICP备15018463号-20