
Shengsheng Sun, Dan Wang, Yuejing Qi, Mingcheng Zong. Design of Reflective Projection Optics Used in Lithographic Focusing and Leveling System[J]. Acta Optica Sinica, 2020, 40(15): 1522002
- Acta Optica Sinica
- Vol. 40, Issue 15, 1522002 (2020)
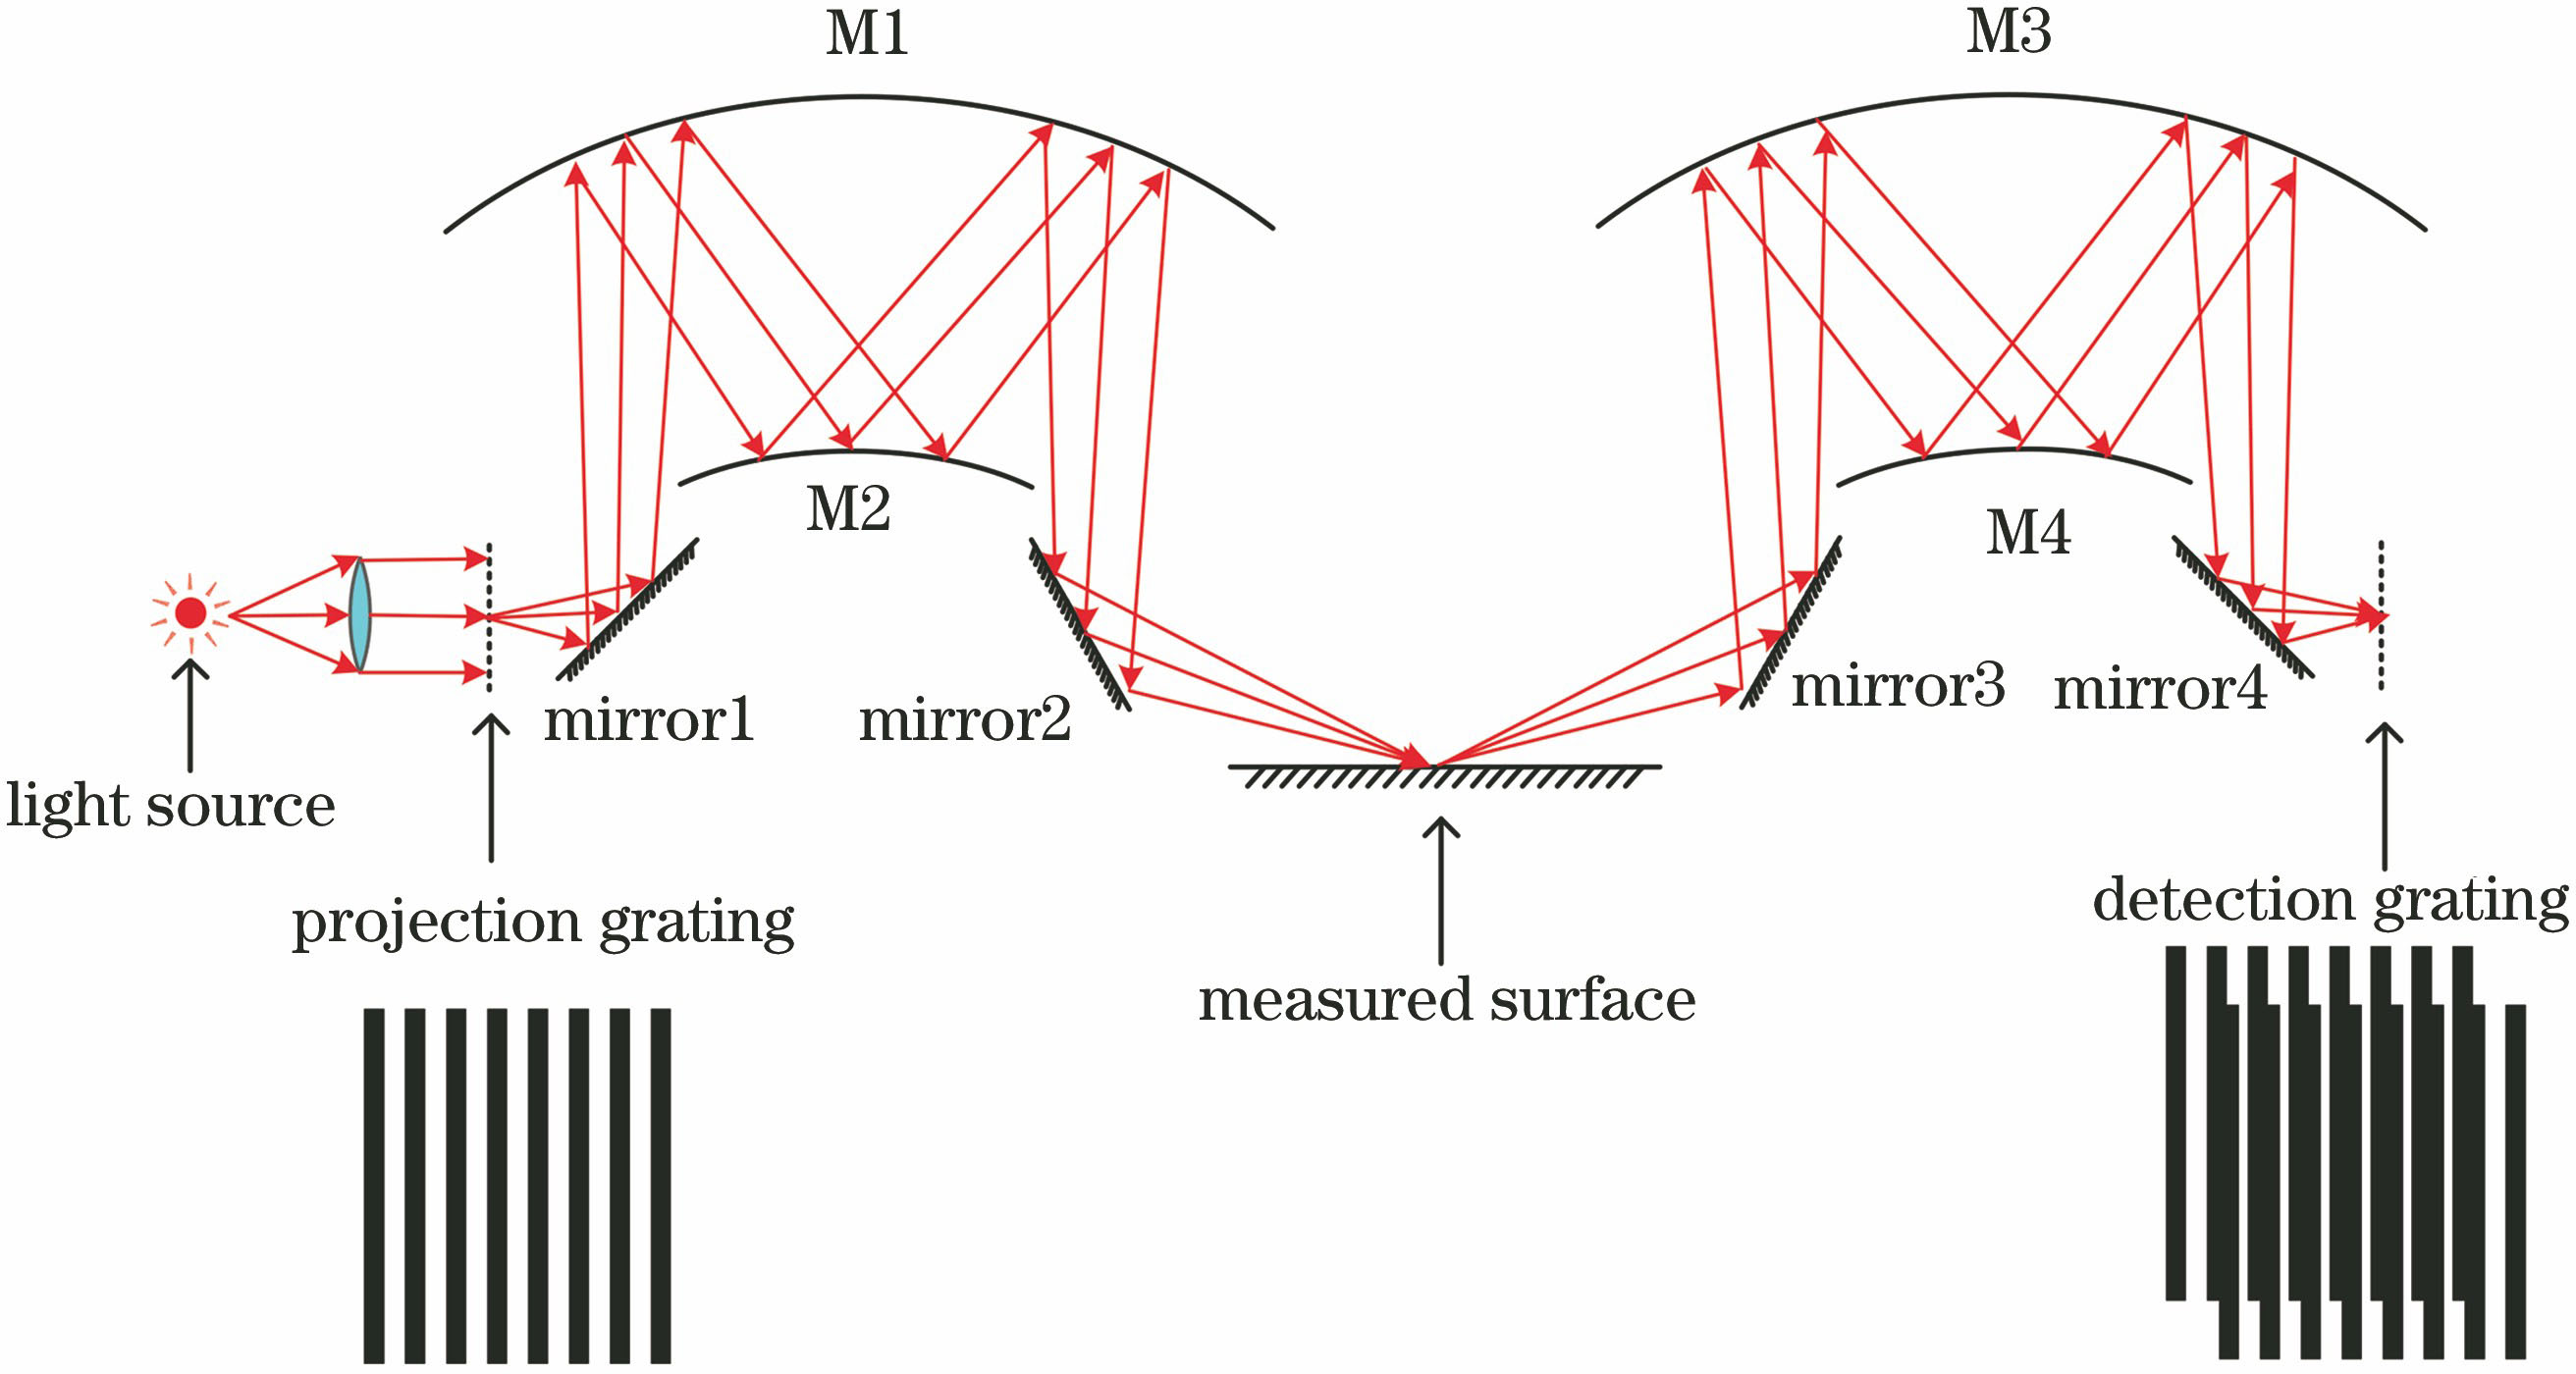
Fig. 1. Schematic of focusing and leveling sensor with reflective optical design
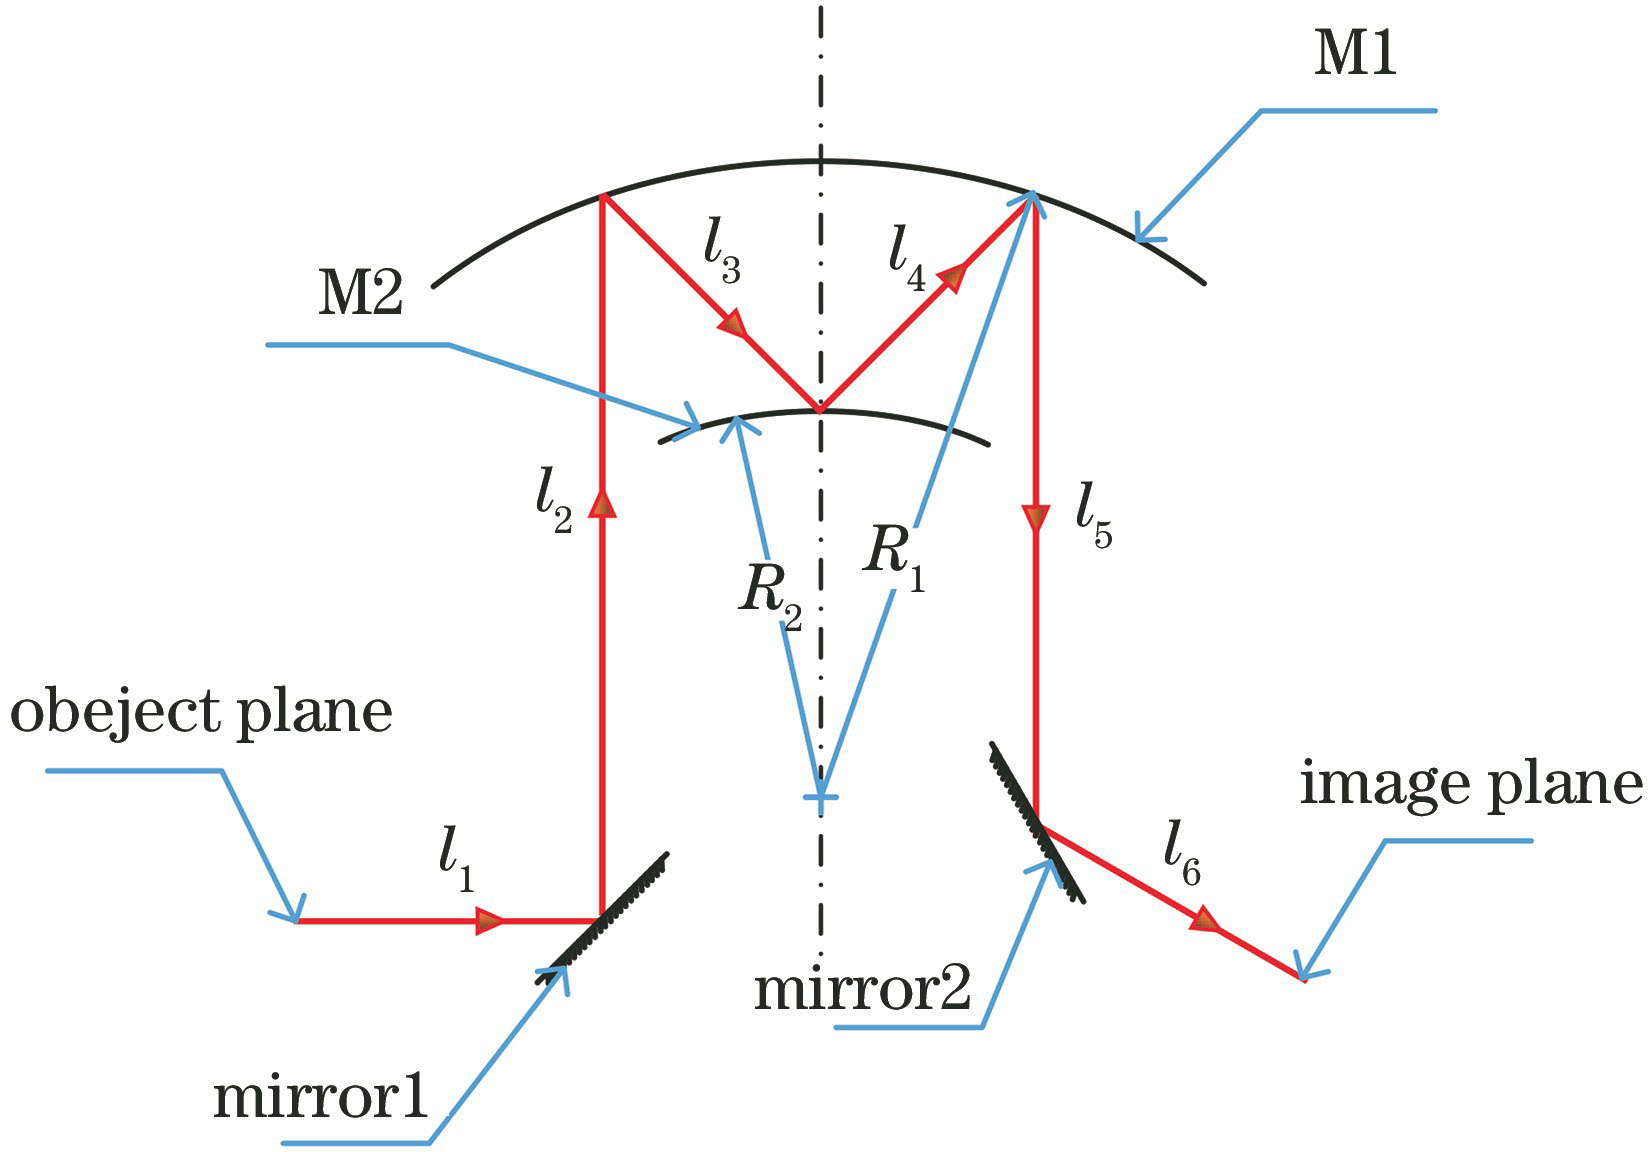
Fig. 2. Schematic of reflective projection system
Fig. 3. Simulated projection grate and its imaging with different aberrations. (a) Projection grate; (b)imaging with no aberration; (c) imaging with 0.95 magnification; (d)imaging with 5 mrad tele-centricity; (e) imaging with 0.08 distortion; (f) imaging with 0.70 modulation transfer function (MTF)
Fig. 4. Measurement accuracy of system with different aberrations. (a) Magnification; (b) tele-centricity; (c) distortion; (d) MTF value
Fig. 5. Spot diagram of projection system
Fig. 6. MTF curve of projection system
Fig. 7. Distortion of projection system
|
Table 1. Requirement for system performance index
|
Table 2. Structure parameter of the system
|
Table 3. Tolerances distribution of the reflection projection system
|
Table 4. Effect of tolerances on MTF
|
Table 5. Monte Carlo analysis results

Set citation alerts for the article
Please enter your email address
© Copyright 2018-2021 | Chinese Laser Press. All Rights Reserved 沪ICP备15018463号-20