• Infrared and Laser Engineering
  • Vol. 49, Issue 9, 20190534 (2020)
Jiawei Yong1,2,3, Youming Guo1,2, and Changhui Rao1,2,*
Author Affiliations
  • 1Key Laboratory on Adaptive Optics, Chinese Academy of Sciences, Chengdu 610209, China
  • 2Institute of Optics and Electronics, Chinese Academy of Sciences, Chengdu 610209, China
  • 3University of Chinese Academy of Sciences, Beijing 100049, China
  • show less
    DOI: 10.3788/IRLA20190534 Cite this Article
    Jiawei Yong, Youming Guo, Changhui Rao. Control method of adaptive optical system based on conjugate combined model of aberration[J]. Infrared and Laser Engineering, 2020, 49(9): 20190534 Copy Citation Text show less
    Correlation matrices of the Zernike modes over different concentric circles. (a) ω = 1; (b) ω = 0.8
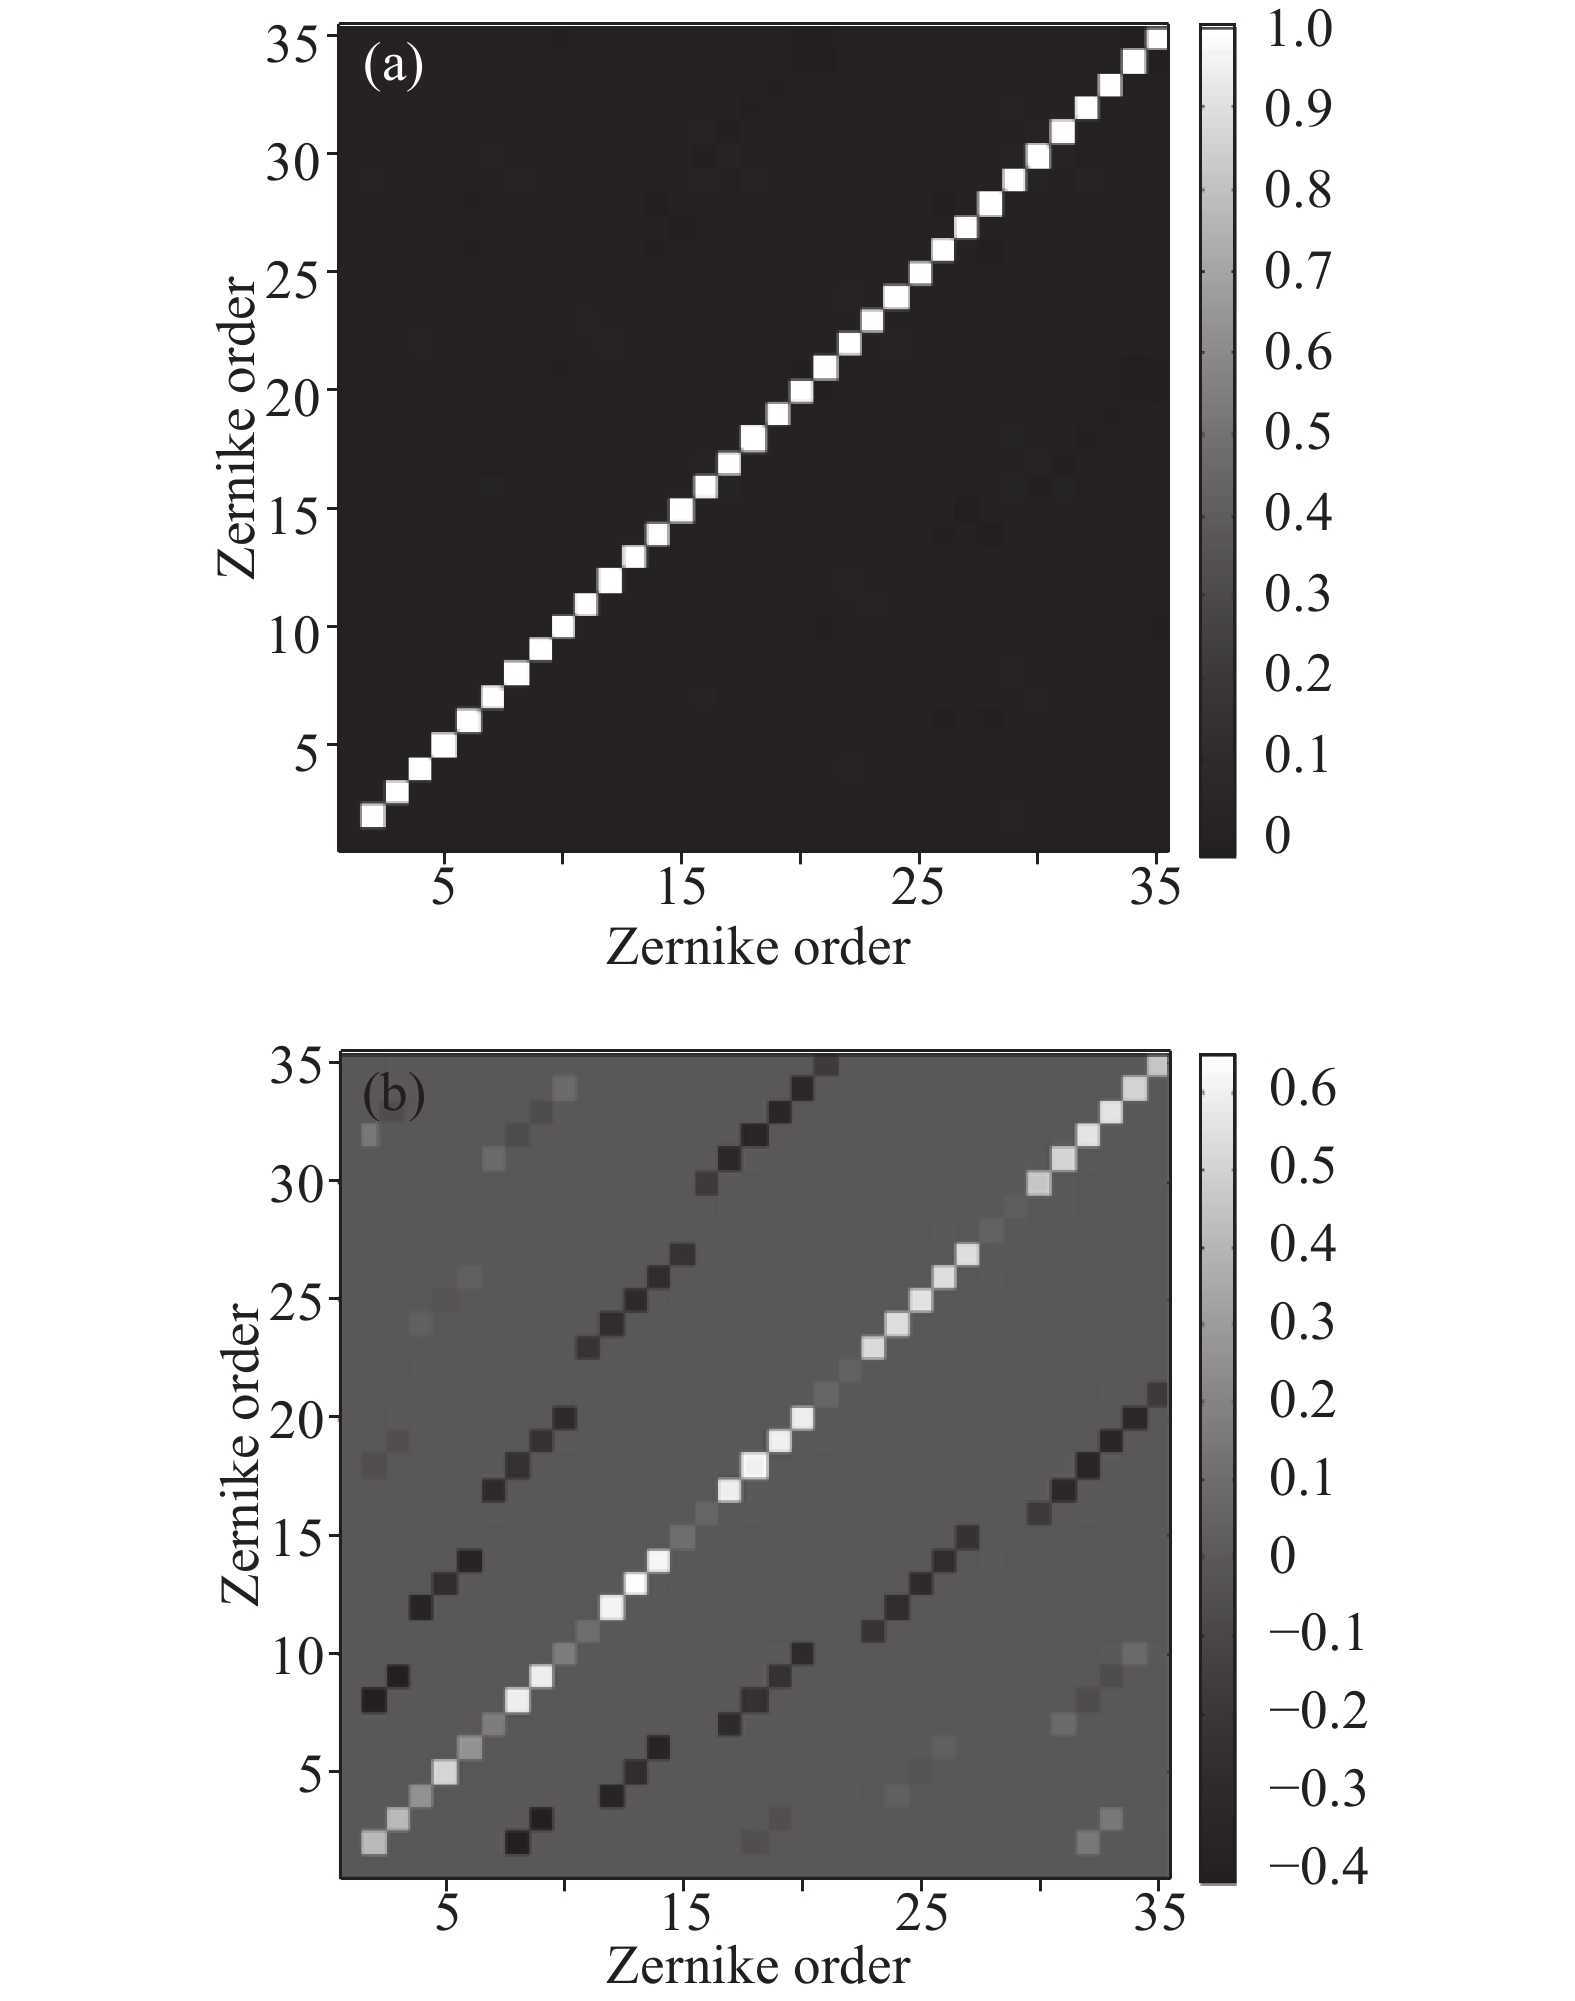
    Fig. 1. Correlation matrices of the Zernike modes over different concentric circles. (a) ω = 1; (b) ω = 0.8
    Counterbalance relationship between defocus and primary spherical
    Fig. 2. Counterbalance relationship between defocus and primary spherical
    Actuator arrangement of 61-element DM
    Fig. 3. Actuator arrangement of 61-element DM
    Sequence of Zernike polynomials
    Fig. 4. Sequence of Zernike polynomials
    Correction result of spherical aberration. (a) Original aberration; (b) Residual error after correction
    Fig. 5. Correction result of spherical aberration. (a) Original aberration; (b) Residual error after correction
    Fitting residual of each aberration
    Fig. 6. Fitting residual of each aberration
    The second kind of RMS decreasing amplitude ration matrix,corresponding aberration. (a) Z12; (b) Z11; (c) Z17; (d) Z16; (e) Z24; (f) Z23; (g) Z22; (h) C1
    Fig. 7. The second kind of RMS decreasing amplitude ration matrix,corresponding aberration. (a) Z12; (b) Z11; (c) Z17; (d) Z16; (e) Z24; (f) Z23; (g) Z22; (h) C1
    [in Chinese]
    Fig. 7. [in Chinese]
    Schematic diagram of L1, L2 and L3 in RMS decreasing amplitude ration matrix
    Fig. 8. Schematic diagram of L1, L2 and L3 in RMS decreasing amplitude ration matrix
    Imaging quality corresponding to different correction degrees. (a) Strehl ratio; (b) Relative Strehl ratio
    Fig. 9. Imaging quality corresponding to different correction degrees. (a) Strehl ratio; (b) Relative Strehl ratio
    Three cross sections of normalized intensity to each aberration type. (a) Z12;(b) Z11;(c) Z17;(d) Z16;(e) Z24;(f) Z23;(g) Z22;(h) C1
    Fig. 10. Three cross sections of normalized intensity to each aberration type. (a) Z12;(b) Z11;(c) Z17;(d) Z16;(e) Z24;(f) Z23;(g) Z22;(h) C1
    Combined aberration C1 and residuals after corrected by the two methods
    Fig. 11. Combined aberration C1 and residuals after corrected by the two methods
    Simulated imaging results of extended target
    Fig. 12. Simulated imaging results of extended target
    Wavefront aberrationa /λb/λSlope of L1Slope of L2
    Z120.03120.1690.184 60.55
    Z110.02150.142 40.1510.5
    Z170.08490.276 80.306 70.75
    Z160.01770.129 20.1370.5
    Z240.21870.408 70.535 10.95
    Z230.17910.380 20.471 10.9
    Z220.08850.287 20.308 10.77
    C10.03070.246 50.124 50.75
    Table 1.

    Some results after correction of the second kind of aberrations

    对第二类像差校正后的相关结果

    Wavefront aberrationOptimal βRelative Strehl ratio
    Z120.9711.036 4
    Z110.9771.019 3
    Z170.9321.211 2
    Z160.981.015 3
    Z240.6864.363 7
    Z230.911.429 1
    Z220.9231.183 3
    C10.9451.113 2
    Table 2.

    Optimal correction degree and relative Strehl ratio corresponding to each aberration type

    各像差类型对应的最优校正度和相对Strehl ratio

    Evaluating indexImage obtained using traditional methods Image obtained under optimal β
    NMSE0.4180.199
    SNR/dB3.797
    Table 3.

    Comparison of imaging quality of extended target

    扩展目标成像质量比较

    Jiawei Yong, Youming Guo, Changhui Rao. Control method of adaptive optical system based on conjugate combined model of aberration[J]. Infrared and Laser Engineering, 2020, 49(9): 20190534
    Download Citation