• Photonics Research
  • Vol. 8, Issue 2, 135 (2020)
Siwei Long1, Shaopeng Lin2, Decai Ma2, Yunzhong Zhu2, Huashan Li1、3、*, and Biao Wang1、2、4、*
Author Affiliations
  • 1School of Physics, Sun Yat-sen University, Guangzhou 510275, China
  • 2Sino-French Institute of Nuclear Engineering and Technology, Sun Yat-sen University, Zhuhai 519082, China
  • 3e-mail: lihsh25@mail.sysu.edu.cn
  • 4e-mail: wangbiao@mail.sysu.edu.cn
  • show less
    DOI: 10.1364/PRJ.8.000135 Cite this Article Set citation alerts
    Siwei Long, Shaopeng Lin, Decai Ma, Yunzhong Zhu, Huashan Li, Biao Wang. Thermometry strategy developed based on fluorescence contrast driven by varying excitations in codoped LiNbO3[J]. Photonics Research, 2020, 8(2): 135 Copy Citation Text show less
    Comparison between FIR-Em and FIR-Ex thermometry strategies. Schematic diagrams for (a) FIR-Em and (b) FIR-Ex strategies applied to doped LN materials (doped LN structure: gray-O2−, cyan-Nb5+, orange-Li+, magenta-Pr3+). Schematic configurational coordinate diagrams for (c) the FIR-Em strategy in Pr:CLN, and (d), (e) the FIR-Ex strategy in Pr:CLN. The excitation wavelengths associated with (c) and (d) are 463 nm, while that with (e) is 360 nm. The solid lines present the crucial radiative processes, while the dashed curves illustrate the nonradiative processes Rx (x=1 to 6). IVCT1/2 represents the two relevant Pr3+–Nb5+ IVCT states.
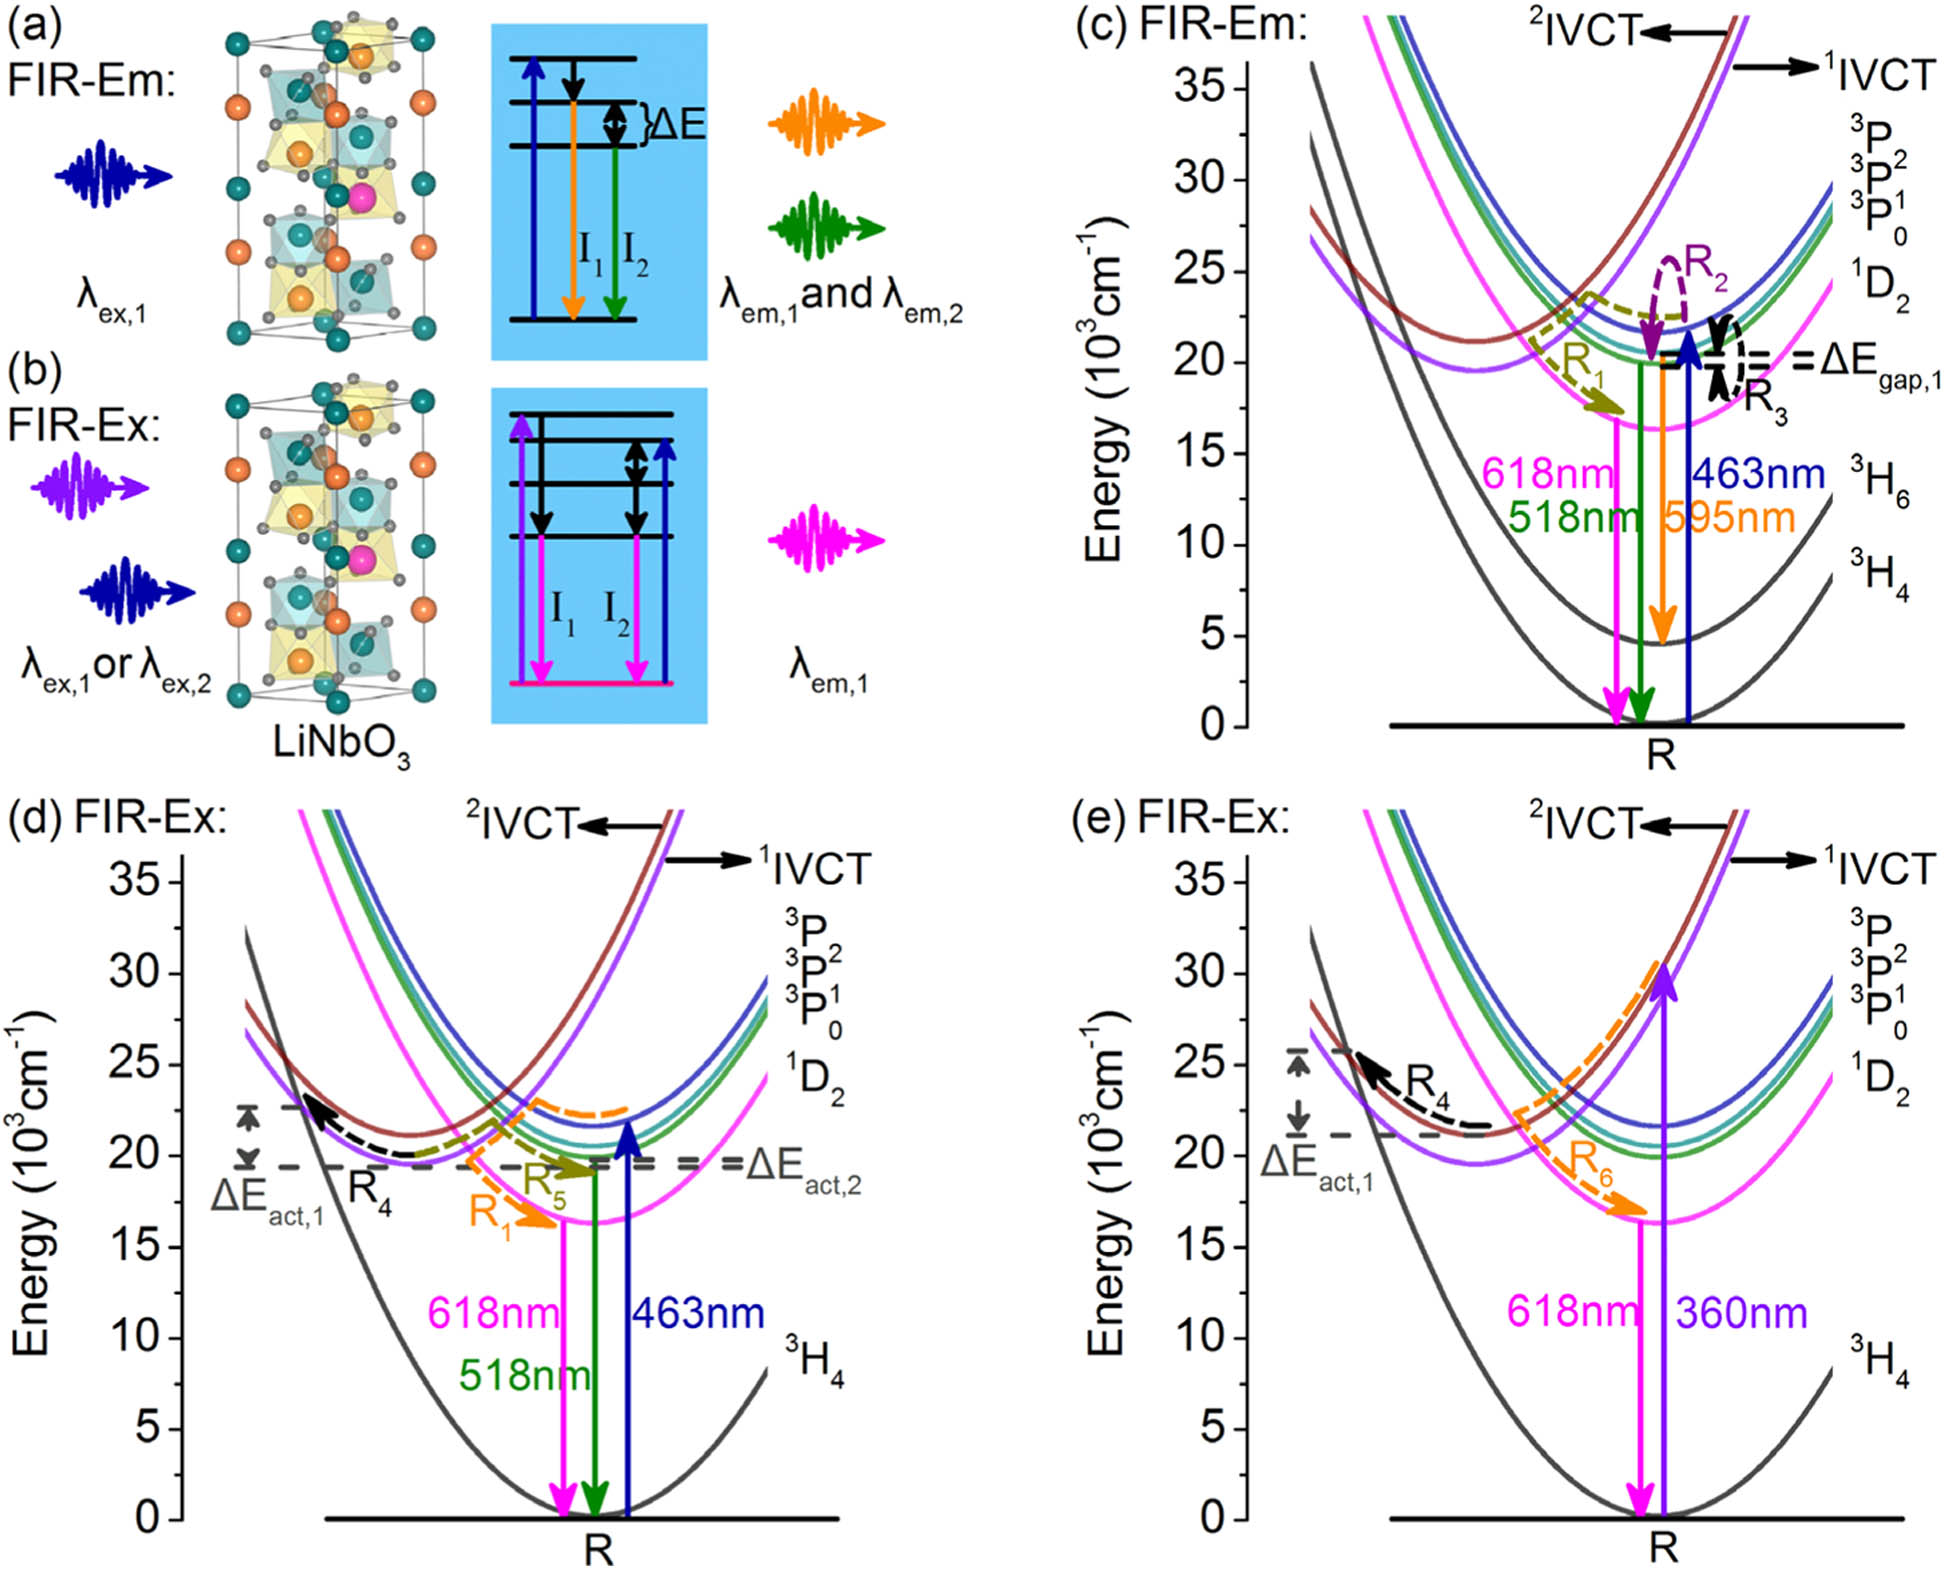
    Fig. 1. Comparison between FIR-Em and FIR-Ex thermometry strategies. Schematic diagrams for (a) FIR-Em and (b) FIR-Ex strategies applied to doped LN materials (doped LN structure: gray-O2, cyan-Nb5+, orange-Li+, magenta-Pr3+). Schematic configurational coordinate diagrams for (c) the FIR-Em strategy in Pr:CLN, and (d), (e) the FIR-Ex strategy in Pr:CLN. The excitation wavelengths associated with (c) and (d) are 463 nm, while that with (e) is 360 nm. The solid lines present the crucial radiative processes, while the dashed curves illustrate the nonradiative processes Rx (x=1 to 6). IVCT1/2 represents the two relevant Pr3+–Nb5+ IVCT states.
    Temperature-dependent excitation and emission spectra. The normalized fluorescence (a) excitation spectra monitored at 618 nm and (b) emission spectra under 360 and 463 nm excitations at room temperature for Pr:CLN and Pr:Mg:CLN. The temperature-dependent excitation spectra of (c) Pr:CLN and (d) Pr:Mg:CLN monitored at 618 nm at temperatures ranging from 20 to 430 K. The spectra are normalized with respect to the (c), (d) 463 nm excitation peaks.
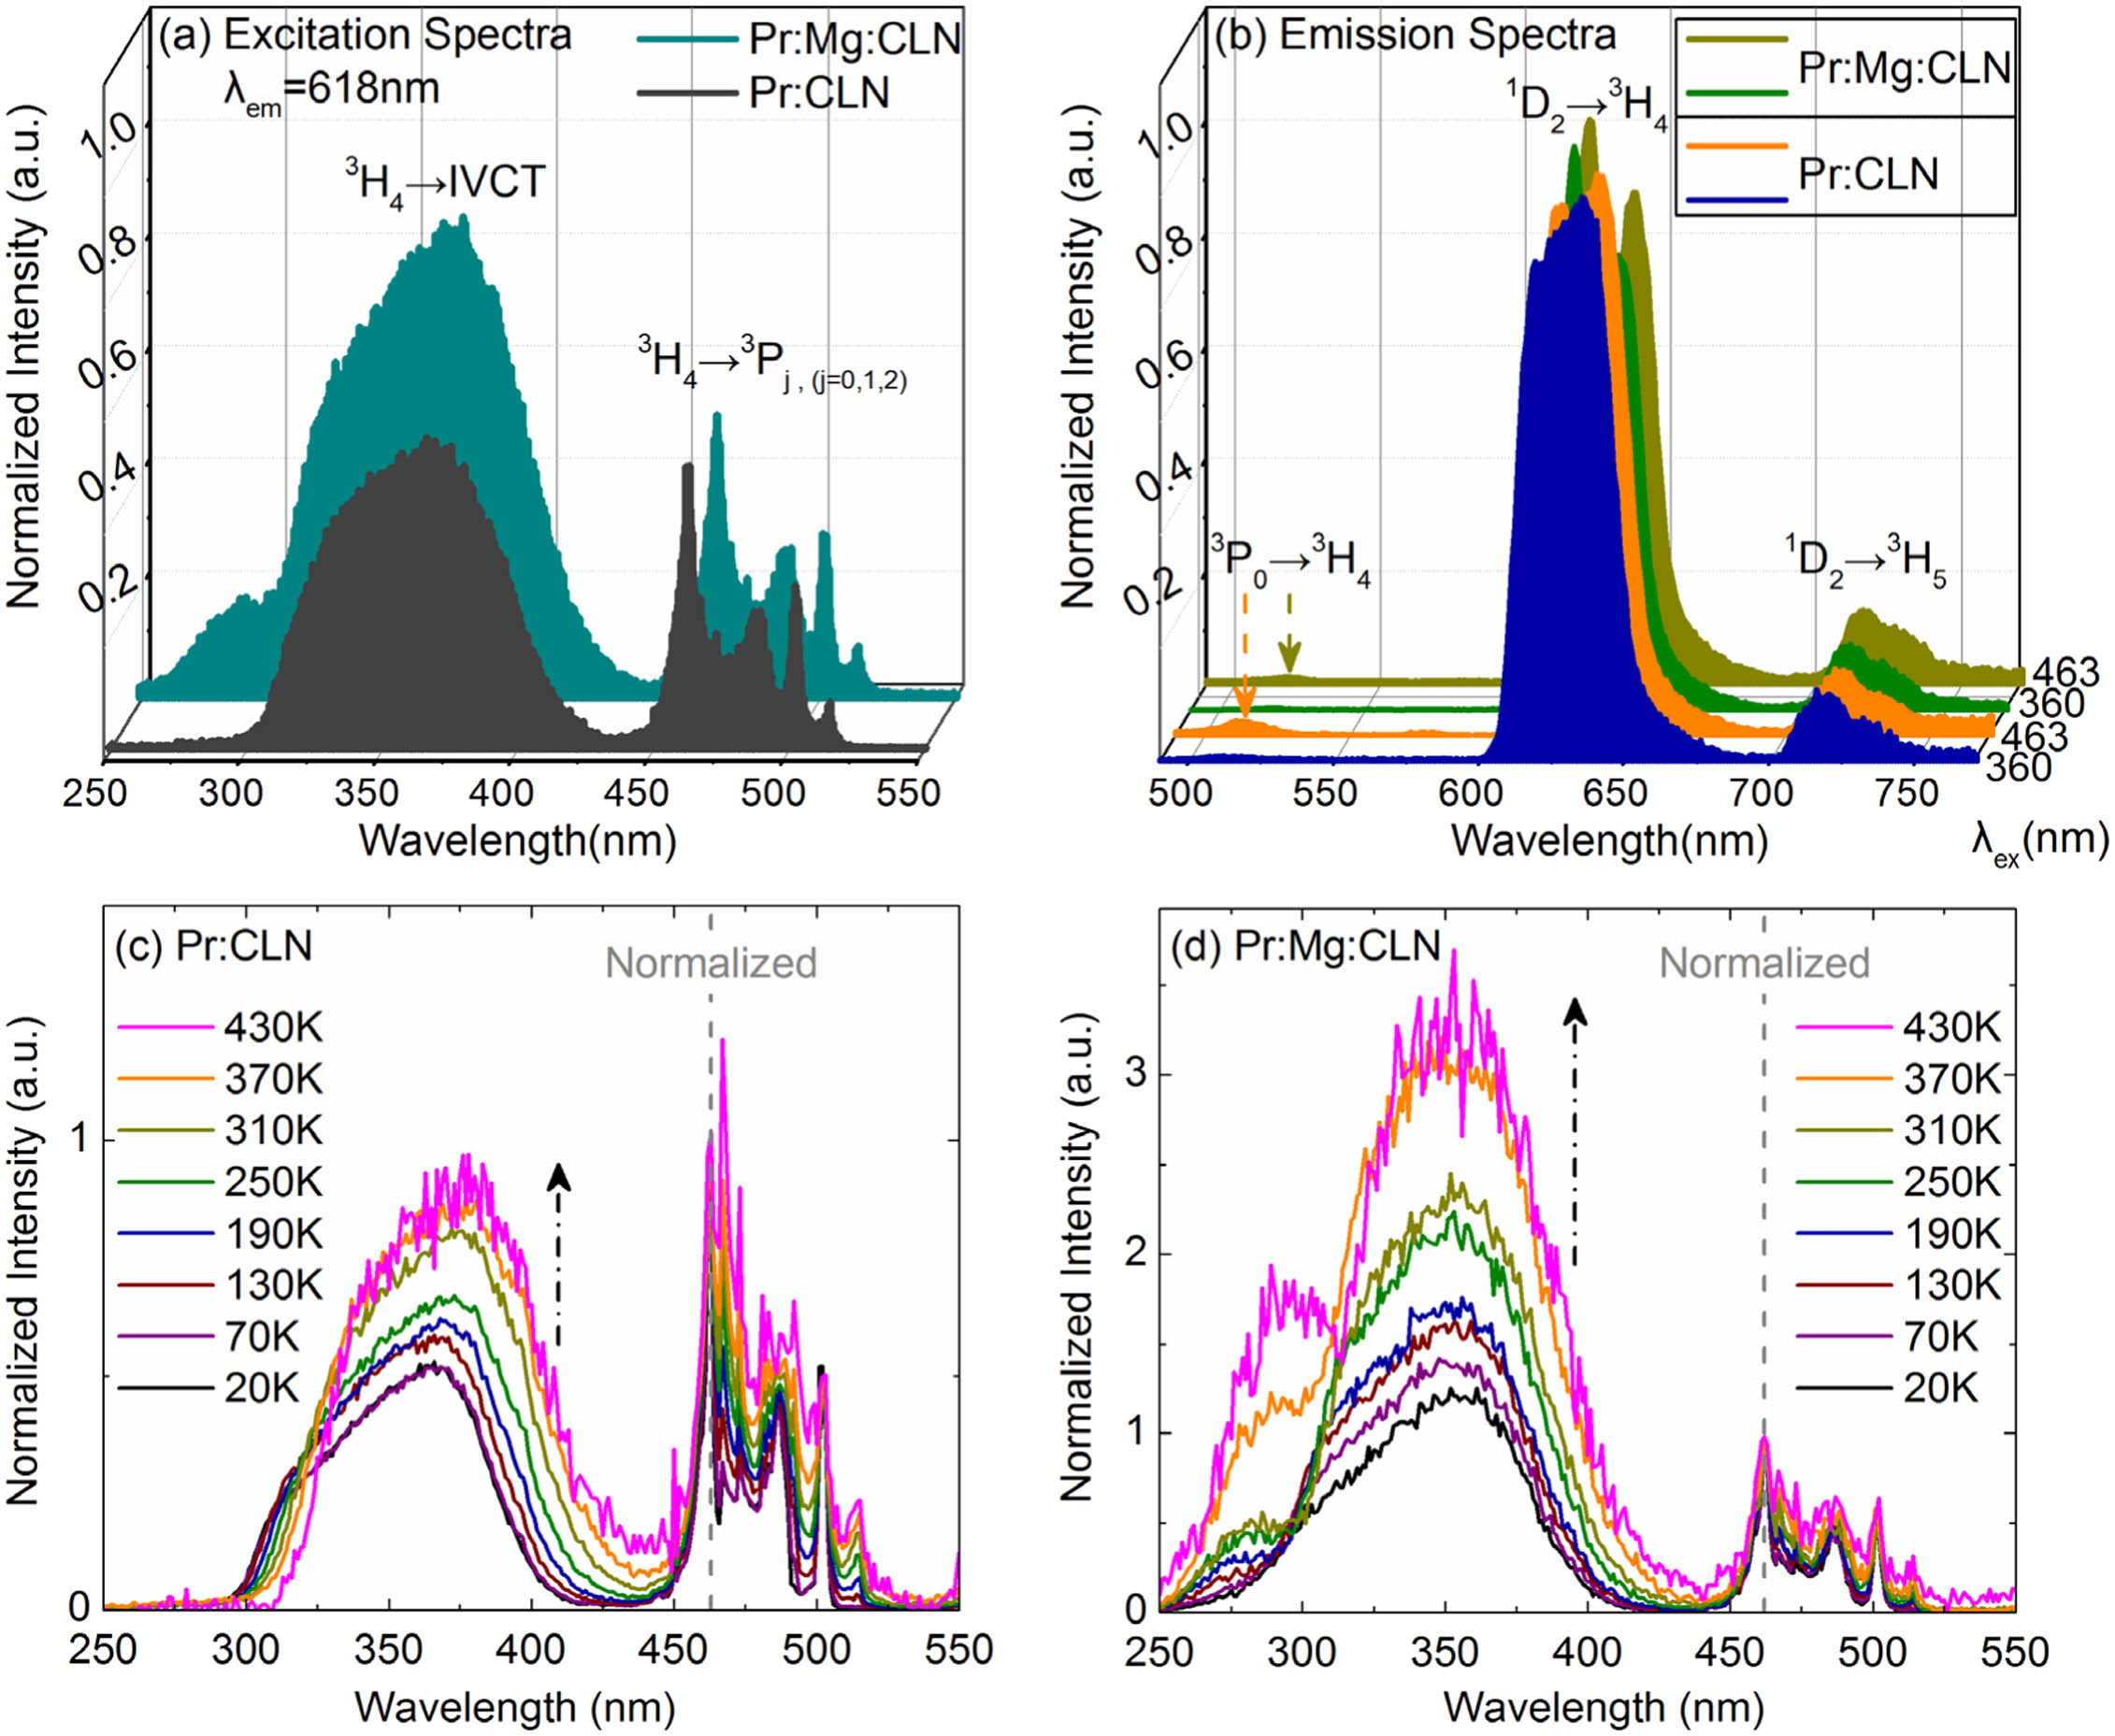
    Fig. 2. Temperature-dependent excitation and emission spectra. The normalized fluorescence (a) excitation spectra monitored at 618 nm and (b) emission spectra under 360 and 463 nm excitations at room temperature for Pr:CLN and Pr:Mg:CLN. The temperature-dependent excitation spectra of (c) Pr:CLN and (d) Pr:Mg:CLN monitored at 618 nm at temperatures ranging from 20 to 430 K. The spectra are normalized with respect to the (c), (d) 463 nm excitation peaks.
    Thermal sensitivity of rationally doped CLN employing the FIR-Ex strategy. The temperature dependences of normalized intensity of 618 nm red emission under 360 and 463 nm excitations along with the fitting curves (solid line) for (a) Pr:CLN and (b) Pr:Mg:CLN. The temperature dependences of the emission intensity ratio R360/463 (left vertical axis) and the absolute/relative temperature sensitivity SA/SR (right vertical axis) for (c) Pr:CLN and (d) Pr:Mg:CLN. The notation “fitting curves x” means the function is obtained by implementing the Eq. (x).
    Fig. 3. Thermal sensitivity of rationally doped CLN employing the FIR-Ex strategy. The temperature dependences of normalized intensity of 618 nm red emission under 360 and 463 nm excitations along with the fitting curves (solid line) for (a) Pr:CLN and (b) Pr:Mg:CLN. The temperature dependences of the emission intensity ratio R360/463 (left vertical axis) and the absolute/relative temperature sensitivity SA/SR (right vertical axis) for (c) Pr:CLN and (d) Pr:Mg:CLN. The notation “fitting curves x” means the function is obtained by implementing the Eq. (x).
    (a) Comparison of absolute temperature sensitivities SA in different thermometry strategies, including FIR-Ex strategies: Pr:CLN (360 and 463 nm excitations) (this work); Pr:Mg:CLN (360 and 463 nm excitations) (this work); Pr:Mg:CLN#2 (280 and 463 nm excitations) (this work); and FIR-Em strategies: Pr:CaTiO3 (Ref. [14]); Nd:NaYF4#1 (740 and 864 nm emissions) (Ref. [6]); Nd:NaYF4#2 (740 and 803 nm emissions) (Ref. [6]); Er:Y7O6F9 (Ref. [4]); Er:NaYb2F7 (Ref. [2]); Pr:YAG (Ref. [20]); Tm:YF3 (Ref. [21]); and Dy:YAG (Ref. [1]). As for absolute sensitivities of FIR-Em strategies, the solid line represents data reported in reference papers, while the dashed line represents fitting results based on the principle of FIR-Em scheme (See Data File 1). (b) Comparison of relative temperature sensitivities SR in different thermometry strategies. In the inset, the temperature dependences of normalized intensity of 618 nm red emission under 280 nm excitation (left vertical axis) and emission intensity ratio R280/463 (right vertical axis) for Pr:Mg:CLN.
    Fig. 4. (a) Comparison of absolute temperature sensitivities SA in different thermometry strategies, including FIR-Ex strategies: Pr:CLN (360 and 463 nm excitations) (this work); Pr:Mg:CLN (360 and 463 nm excitations) (this work); Pr:Mg:CLN#2 (280 and 463 nm excitations) (this work); and FIR-Em strategies: Pr:CaTiO3 (Ref. [14]); Nd:NaYF4#1 (740 and 864 nm emissions) (Ref. [6]); Nd:NaYF4#2 (740 and 803 nm emissions) (Ref. [6]); Er:Y7O6F9 (Ref. [4]); Er:NaYb2F7 (Ref. [2]); Pr:YAG (Ref. [20]); Tm:YF3 (Ref. [21]); and Dy:YAG (Ref. [1]). As for absolute sensitivities of FIR-Em strategies, the solid line represents data reported in reference papers, while the dashed line represents fitting results based on the principle of FIR-Em scheme (See Data File 1). (b) Comparison of relative temperature sensitivities SR in different thermometry strategies. In the inset, the temperature dependences of normalized intensity of 618 nm red emission under 280 nm excitation (left vertical axis) and emission intensity ratio R280/463 (right vertical axis) for Pr:Mg:CLN.
    Siwei Long, Shaopeng Lin, Decai Ma, Yunzhong Zhu, Huashan Li, Biao Wang. Thermometry strategy developed based on fluorescence contrast driven by varying excitations in codoped LiNbO3[J]. Photonics Research, 2020, 8(2): 135
    Download Citation