We propose what we believe is a novel optical thermometry strategy (FIR-Ex) based on the fluorescence intensity ratio (FIR) between two radiations associated with the same emission peak but different excitation wavelengths, in contrast to the traditional approach (FIR-Em), which depends on the FIR at varying emission wavelengths. The temperature-dependent FIR within the FIR-Ex strategy arises from the different charge/energy evolution routes, rather than the distribution of thermally coupled levels within the FIR-Em strategy. Considerable diversity in thermal behaviors and luminescence mechanisms was demonstrated by analyzing the 618 nm red emission in -doped congruent (Pr:CLN) under 360 and 463 nm excitations. The temperature sensitivity was further improved via codoping due to the optimization of charge dynamics and energy transfer processes. Given its wide detection scope, relatively high absolute sensitivity at low temperature, and high tunability of temperature sensitivity, the FIR-Ex strategy is promising for developing optical temperature-sensing materials with high performance.
1. INTRODUCTION
Accurate temperature sensing is vital to thermal management, and thus plays an important role in modern manufacturing, medical practice, and scientific research. Optical thermometry has received great attention recently as an alternative to traditional contact thermometry due to the prominent advantages of being noncontact and nonintrusive, having high spatial resolution, and producing a short response time. Schemes based on fluorescent lifetime (FL), fluorescent intensity (FI), or fluorescent intensity ratio (FIR) have been demonstrated in various crystal matrices embedded with rare-earth (RE) dopants [1,2]. Particularly, self-referencing FIR strategy related to two thermally coupled energy levels (TCELs) [3,4] is favored due to fast detection as well as immunity against the fluctuations of excitation efficiency and emission loss. To achieve higher sensitivity in FIR strategies, a wider energy gap between TCELs is required to enhance the temperature variation of FIR. However, with energy gap exceeding [5], the population distribution across the two TCELs deviates from the Boltzmann law. The deviation, called decoupling, leading to the indeterministic temperature dependence of FIR, precludes the application in FIR optical thermometry. Therefore, while encouraging high temperature sensitivity based on FIR strategy has been realized [6], further improvement of FIR thermometry is severely impeded by the intrinsic drawback. To overcome this challenge, a variety of modified FIR strategies have been developed. For example, an FIR strategy combined with redshift of charge-transfer excitation band was presented by Zhou et al. [3]. FIRs originating from two different active ions exhibiting diverse thermal behaviors, such as and or [7,8], were employed to attain high sensitivity. The special process, metal-to-metal intervalence charge transfer (IVCT), was adopted to improve the performance of thermometers based on the coupled and levels of [9]. Recently, high sensitivity of was achieved via diverse thermal responses of two IVCT processes (Tb3+–Mo6+ and Pr3+–Mo6+) [10].
All the current FIR methods, referred to as FIR-Em, are based on temperature-dependent emission spectra generated by single excitation, which consist of two emission bands with sufficient discriminability for signal detection. Alternatively, we speculated that the temperature-dependent excitation spectra, with two excitation bands exhibiting diverse thermal responses, may also serve as the foundation of FIR thermometry. A novel FIR thermometer, referred to as FIR-Ex, could be realized based on different temperature dependences of one specific emission, with the spectra recorded under the same test circumstance by electrical switching between two excitation wavelengths. Compared to traditional FIR-Em approaches, which require the coupling between two target levels to exclude the impact of irrelevant transition events [4,5], our proposed FIR-Ex method provides an additional degree of freedom to rationally design the charge evolution paths upon excitations, and thus could isolate the critical processes even without direct coupling between target levels. Such a compelling feature of FIR-Ex not only addresses the intrinsic drawback of traditional FIR-Em, but also indicates the potential to finely optimize the thermometer performance via the control of charge dynamics with additional dopants. To our knowledge, the above vision regarding temperature-dependent excitation spectra has not been explored so far.
(LN) is an excellent host material in integrated optics. LN doped with RE ions has been intensively studied for various applications, such as lasers, display, bioimaging, and optoelectronic modulators. The flexibility of tuning energy diagram in doped LN provides an ideal platform to test the idea of FIR-Ex. Investigations on Tm:Yb:LN [11] and Eu:LN [12] have been carried out for FIR-Em thermometry applications, yet the reported absolute sensitivities are less than and vanish at low temperatures as restricted by the Boltzmann distribution law. On the other hand, dopant, which has been widely used to obtain high sensitivity in various host crystals within the FIR-Em scheme [13,14], does not work in LN because the blue–green emission originating from coupled levels is completely quenched.
Sign up for Photonics Research TOC. Get the latest issue of Photonics Research delivered right to you!Sign up now
In this work, we present a novel FIR-Ex thermometry in -doped congruent LN (Pr:CLN), taking advantage of the different temperature dependences of the red emissions under excitations at 360 and 463 nm. codopant was introduced to substantially increase the sensitivity, demonstrating the potential to optimize FIR-Ex performance by refining the charge and energy transition processes. Relatively high sensitivity was attained within a wide temperature range (70 to 430 K) in codoped Pr:Mg:CLN.
2. EXPERIMENT
Pr:CLN and Pr:Mg:CLN single crystals of high quality were prepared by the Czochralski method. The molar ratio Li/Nb in melt was 0.946. The concentrations in both crystals were 1 mol%, while the concentration in Pr:Mg:CLN was 5 mol%. The dopant concentration was chosen to eliminate the intrinsic defects. Wafers oriented perpendicularly to the axis with 2.2 mm thickness were cut from the central part of the crystals and polished on both sides for optical analysis.
Both the temperature-dependent fluorescence excitation and emission spectra were recorded using a photoluminescence spectrometer (Edinburgh Instruments FLSP980). Fluorescence excitation spectra were monitored at 618 nm, while the emission spectra were recorded under 360 and 463 nm excitations. At each temperature, the emission spectra under two excitations were measured successively by switching emitting wavelength of a xenon lamp, followed by adjusting temperature to the next measurement point using an advanced research system (ARS) closed cycle He refrigerator.
3. RESULTS AND DISCUSSION
A. Fundamental Mechanisms for FIR-Em and FIR-Ex Thermometry
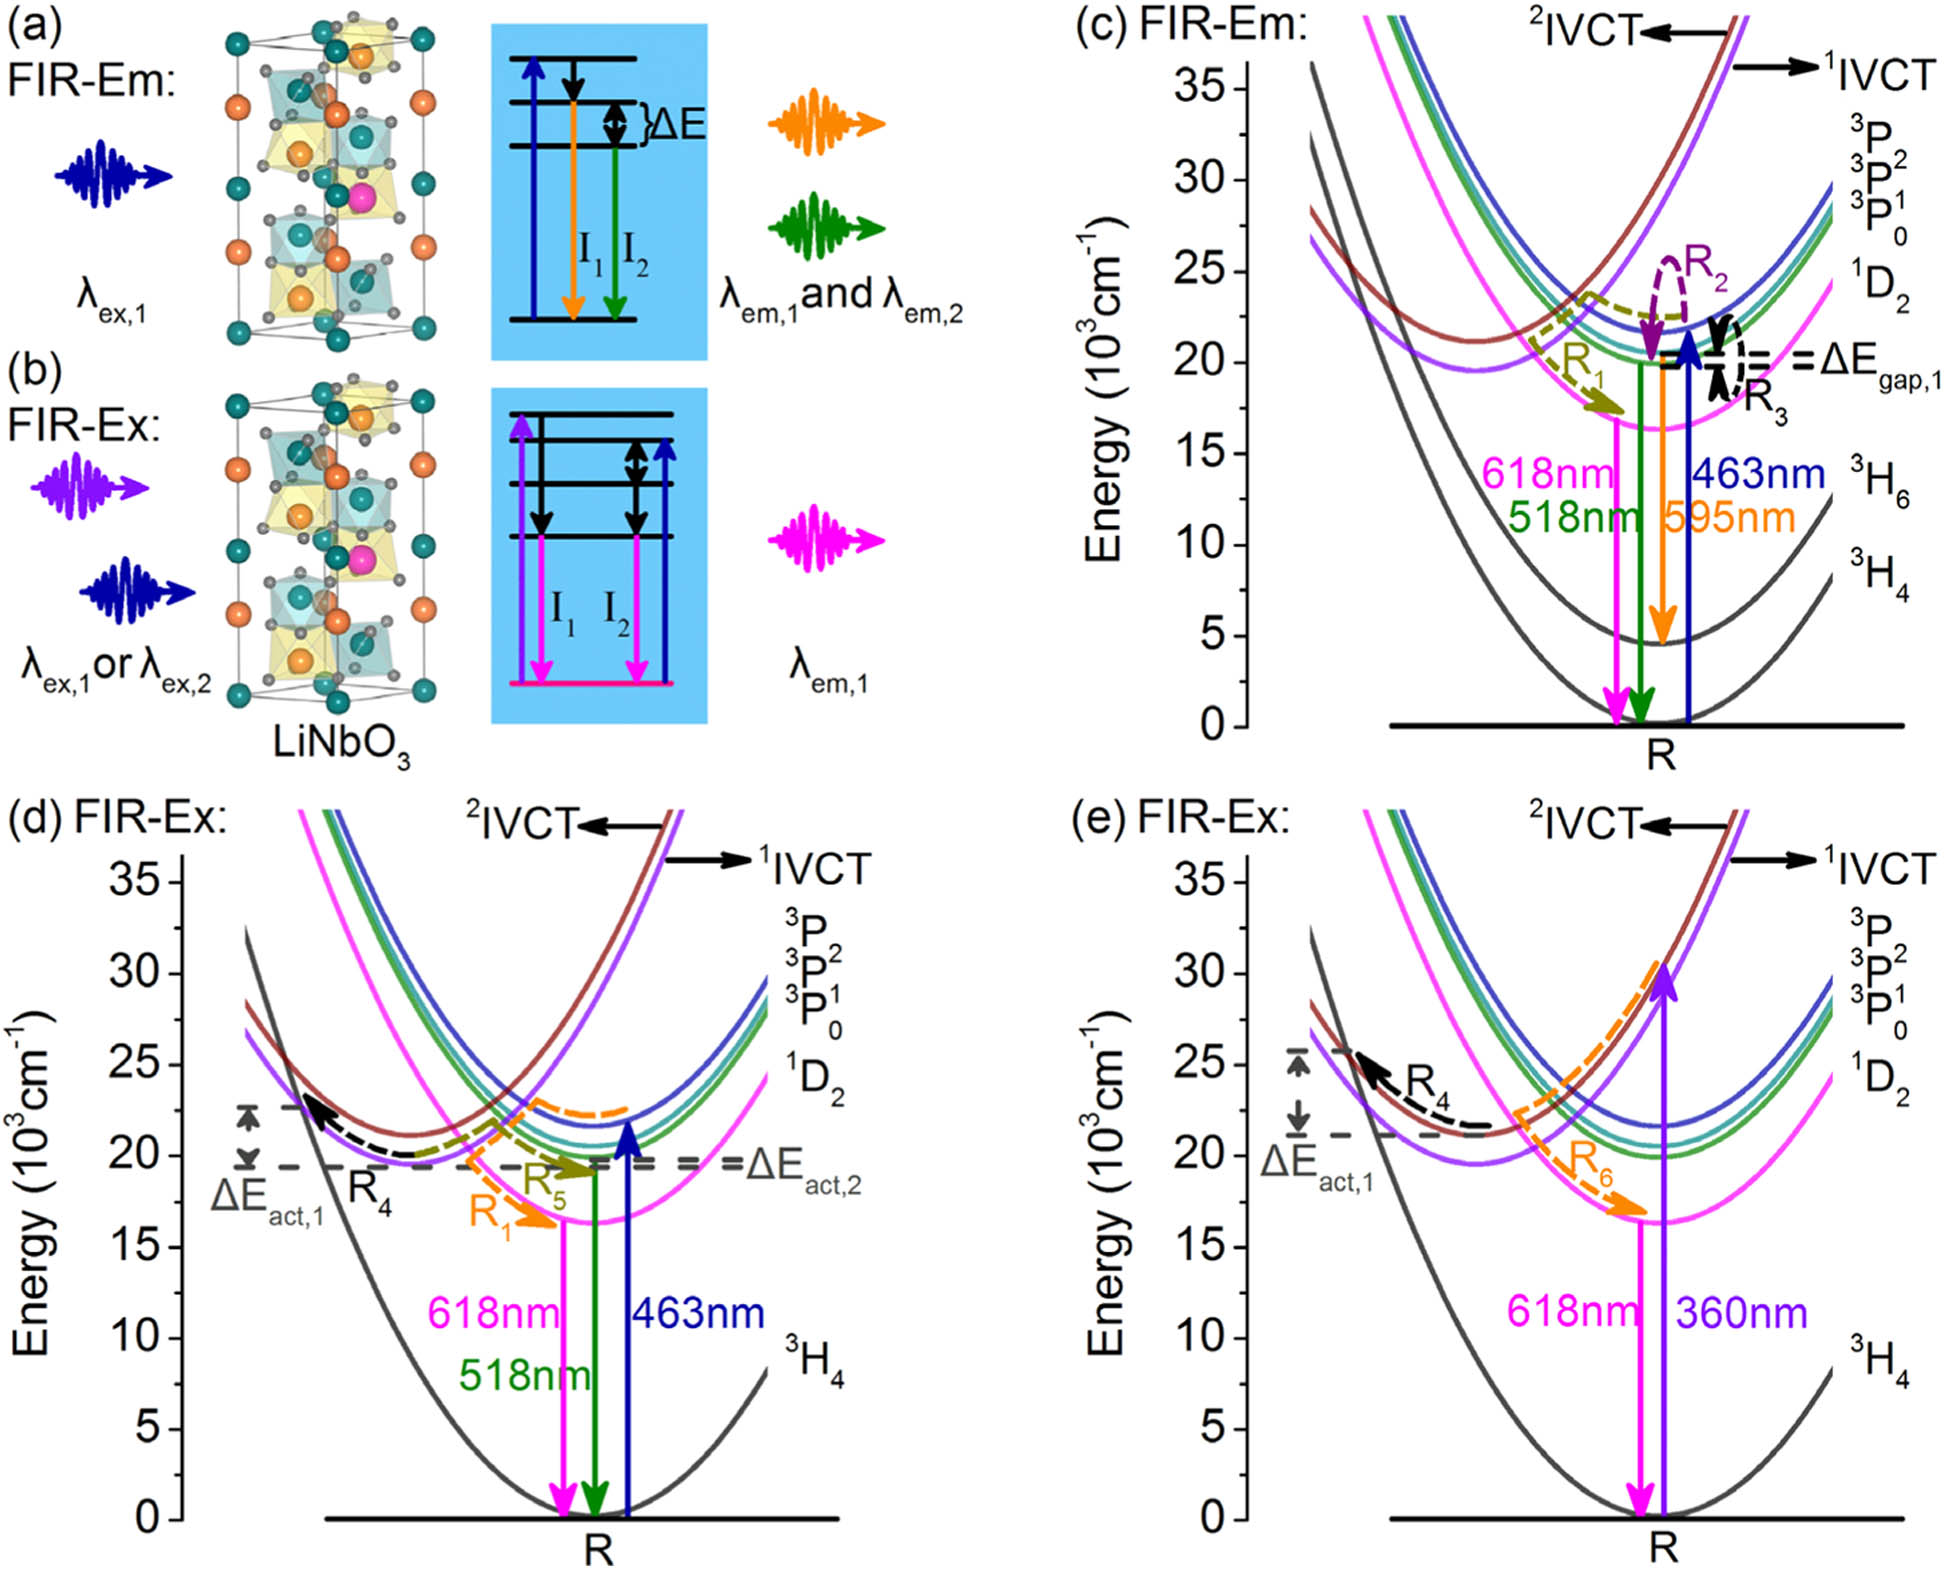
The mechanisms of FIR-Em and FIR-Ex thermometries with LN are schematically illustrated in Figs. 1(a) and 1(b), respectively. In the FIR-Em strategy, under excitation at a fixed , two emission bands at and originating from two TCELs were detected simultaneously. Based on the Boltzmann population distribution between TCELs, the temperature would be evaluated by calculating the FIR between two emission bands. In the FIR-Ex strategy, sequential emissions at in response to the excitations at and exhibit distinct temperature dependences due to different luminescence routes. The temperature would be evaluated via FIR between emissions at the same band while excited at and .
Figure 1.Comparison between FIR-Em and FIR-Ex thermometry strategies. Schematic diagrams for (a) FIR-Em and (b) FIR-Ex strategies applied to doped LN materials (doped LN structure: gray-, cyan-, orange-, magenta-). Schematic configurational coordinate diagrams for (c) the FIR-Em strategy in Pr:CLN, and (d), (e) the FIR-Ex strategy in Pr:CLN. The excitation wavelengths associated with (c) and (d) are 463 nm, while that with (e) is 360 nm. The solid lines present the crucial radiative processes, while the dashed curves illustrate the nonradiative processes ( to 6). represents the two relevant Pr3+–Nb5+ IVCT states.
The transitions between states associated with Pr dopant incorporating TCELs in Pr:CLN, as supposed to be utilized in FIR-Em strategy, are illustrated in Fig. 1(c). Under 463 nm excitation, an electron would be excited from to , followed by three important nonradiative processes (, , ): , relax from to via the crossovers with IVCT states [15]; , relax from to , and then to ; , reallocate between thermally coupled levels and [16]. A majority of hot electrons would experience fast cooling via the above nonradiative process , resulting in dominant red emissions and weak blue–green emissions in the visual domain. In line with the FIR-Em scheme, the orange (595 nm) and blue–green (518 nm) emission pair should be adopted for sensing so as to harness the temperature dependence of charge distribution between the TCELs and . Nevertheless, this is not feasible because the orange and blue–green emissions in Pr:CLN are too weak for our equipment to precisely measure their variations.
In comparison, the transition mechanism in Pr:CLN proposed for FIR-Ex strategy is illustrated in Figs. 1(d) and 1(e). The and states associated with the exciton bounded on [17] have been confirmed by Gaussian decomposition of the broad excitation band ranging from 250 to 450 nm into two Gaussian peaks in Pr:CLN [18]. The energy positions of and in the configurational coordinate diagram were determined based on the Gaussian decomposition and the corresponding results in a previous study [19]. Under 463 nm excitation, the hot electrons would first be populated to the and reallocated between TCELs and . The majority of electrons would intercross with the states, while the remaining charges recombine with the holes to emit at 595 and 518 nm. The key emission from to at 618 nm would then proceed after the nonradiative transition from to , with the quenching property governed by two decay channels. One is to intercross with (), and the other is to return back to (), with activation energies and , respectively. Under 360 nm excitation, was populated via another nonradiative process, : electrons would be promoted to states. In case the hybridization between and is weak, the electrons would relax from directly to , bypassing levels , with the subsequent quenching of red emission from determined by the crossover between and . Such different charge evolution routes under 463 and 360 nm excitations provide the sufficient temperature-dependent FIR demanded in FIR-Ex strategy. In the presence of an Mg codopant, the dominant mechanism for FIR-Ex is preserved, given the absence of emergent states within the relevant energy range. The sensing performance, though, could be optimized due to the changes of activation barriers and the consequential variations of competing transition rates.
B. Temperature-Dependent Emission and Excitation Spectra
The excitation spectra for Pr:CLN and Pr:Mg:CLN acquired under the same measurement circumstances at room temperature are presented in Fig. 2(a). The excitation bands from 450 to 530 nm attributed to the transitions from to in Pr:CLN and Pr:Mg:CLN were normalized to the same intensity. The relative intensity of the broad IVCT excitation band [18] centered at 360 nm was noticeably enhanced when codoped with . An extra excitation peak at 280 nm emerges only in Pr:Mg:CLN, which may be attributed to the transitions associated with new defect levels introduced by dopants in lattice [18] and can be adopted for exciting via host sensitivity. As depicted in Fig. 2(b), dominant red emissions () and completely quenched orange emission () are observed in both crystals at both excitation wavelengths (360 and 463 nm). The blue–green emissions () at 518 nm were very weak under 463 nm excitation, while being completely quenched under 360 nm excitation in both crystals. The orange and blue–green emission pair adopted for FIR-Em strategy in Pr:YAG [20] is inaccessible in Pr:CLN, and thus the following discussions will focus on the FIR-Ex strategy.
Figure 2.Temperature-dependent excitation and emission spectra. The normalized fluorescence (a) excitation spectra monitored at 618 nm and (b) emission spectra under 360 and 463 nm excitations at room temperature for Pr:CLN and Pr:Mg:CLN. The temperature-dependent excitation spectra of (c) Pr:CLN and (d) Pr:Mg:CLN monitored at 618 nm at temperatures ranging from 20 to 430 K. The spectra are normalized with respect to the (c), (d) 463 nm excitation peaks.
To explore the potential of Pr:CLN in FIR-Ex thermometry, we measured the temperature-dependent excitation spectra monitored at 618 nm. The intensities of both the excitation peaks at 463 and 360 nm decrease gradually with increasing temperature, as expected from the promotion of nonradiative decay channels. The relative intensity of the 360 nm excitation peak compared to that of the 463 nm peak remarkably increases with increasing temperature, as presented in Fig. 2(c), indicating that the red luminescence under different excitations exhibits different thermal behaviors. Similarly, we investigated the normalized temperature-dependent excitation spectra of Pr:Mg:CLN. As presented in Fig. 2(d), the FIR between various excitation wavelengths was noticeably augmented with incorporation, suggesting that Pr:Mg:CLN is more attractive for FIR-Ex strategy.
C. Tunable Sensitivity of FIR-Ex Thermometry and Performance Comparison with FIR-Em Thermometry
To validate the feasibility of FIR-Ex strategy, we compared its FIR and temperature sensitivity with those of the FIR-Em strategy. As for the traditional FIR-Em thermometry, the temperature dependence of FIR originating from TCELs could be expressed as [21] where and represent the emission intensities; and are constants; is the Boltzmann constant; and represents the energy gap between TCELs.
The absolute and relative temperature sensitivity and , as key parameters for characterizing the temperature sensor, could be derived by the following formulas: The orange and blue–green emission pair is inaccessible in Pr:CLN but could be adopted for FIR-Em strategy in Pr:YAG [20]. The FIR of orange and blue–green emission pair in Pr:YAG was fitted using Eq. (1) by Hu et al., resulting in a maximum absolute sensitivity of at 573 K.
As for the FIR-Ex optical thermometry, a stabilized pumping source with two proper operating wavelengths and electronic switching is required, which is achieved by our developed platform based on a xenon lamp. The normalized integrated intensities of red emission from 585 to 685 nm in Pr:CLN under 360 and 463 nm excitations are shown in Fig. 3(a). Distinct temperature-dependent attenuation behaviors were observed, as expected from our proposed transition mechanism discussed above. At both excitation wavelengths, the excited level was populated via the IVCT states. The attenuation behaviors were both related to the thermally activated energy transfer from the IVCT states to the ground level () [18]. However, under 463 nm excitation, the additional decay channel enabled by thermal activation back to states also contributes to the fluorescence suppression, resulting in faster attenuation with increasing temperature compared to that under 360 nm excitation.
Figure 3.Thermal sensitivity of rationally doped CLN employing the FIR-Ex strategy. The temperature dependences of normalized intensity of 618 nm red emission under 360 and 463 nm excitations along with the fitting curves (solid line) for (a) Pr:CLN and (b) Pr:Mg:CLN. The temperature dependences of the emission intensity ratio (left vertical axis) and the absolute/relative temperature sensitivity (right vertical axis) for (c) Pr:CLN and (d) Pr:Mg:CLN. The notation “fitting curves x” means the function is obtained by implementing the Eq. (x).
According to the Struck theory [10,22], the normalized intensity of 618 nm red emission in Pr:CLN under 360 nm excitation could be fitted using the formula indicating a single energy barrier, where represents the normalized intensity; and represent the intensity at temperature and 0 K, respectively; is a constant; is the Boltzmann constant; and represents the activation energy from the state to the crossing between and , as illustrated in Fig. 1(e). From Fig. 3(a), our data can be reasonably fitted to this formula, with the quenching activation energy determined to be 2379.76 . A small deviation from the fitting curve appears at about 190 K, wherein the emission intensity slightly increases with increasing temperature. Based on the prior studies [23,24] for and reporting positive temperature dependence of FI similar to our system, we speculated that the deviation is associated with the phonon-assisted host sensitization via energy transfer from the excited host to . According to the thermally activated exciton model [24], excitons of CLN matrix are generated and self-trapped under UV excitation at a low temperature. With the hopping barriers overcome at a higher temperature, the excitons conduct a thermally activated migration and eventually get trapped by , leading to an increased strength of 618 nm emission. Quantitatively incorporating the sensitization effect into our model requires detailed information about the migration and energy transfer processes, which is beyond the scope of this study, yet deserves future investigations.
In comparison, the 618 nm red emission under 463 nm excitation decreased more rapidly with increasing temperature. We modified Eq. (4) to capture such distinct thermal behavior, where and are constants and represents the activation energy related to the extra quenching channel , as illustrated in Fig. 1(d). Herein, is defined as the energy difference between the minimum of state and the minimum of states, while the additional term of the formula is derived from the symmetric relation between the two quenching channels. As shown in Fig. 3(a), the temperature-dependent intensity fits well to the adjusted formula, with and determined to be and , respectively. The similar values of attained under both excitation conditions verify the common quenching channels from IVCT state to . The rising emission intensity at 190 K observed under 360 nm excitation is absent in this case, indicating that self-trapped excitons for host sensitization could not be effectively activated under lower-energy 463 nm excitation.
To evaluate the temperature sensitivity of FIR-Ex thermometry in Pr:CLN, we considered the emission intensity ratio of the integral red emission (618 nm) intensity under 360 nm excitation to that under 463 nm excitation, as shown in Fig. 3(c). The monotonic increase of with increasing temperature facilitates its application in FIR-Ex optical thermometry ranging from 70 to 430 K. Derived from Eqs. (4) and (5), the temperature dependence of could be well fitted with the formula, The deviation of measured integrated intensities from the fitting curves, which could not be eliminated by repeated measurements, is likely to be associated with the given experimental conditions. Nevertheless, a smoother variation trend with better fitting has been attained for the curves of intensity ratio , suggesting that the common pumping source used to generate different excitation lights via electrical switching in the FIR-Ex strategy could help eliminate the adverse effect arising from fluctuations of excitation efficiency and emission loss and systematic deviation under the given experimental conditions, similar to the self-referencing in the FIR-Em strategy.
The temperature-dependent and in Pr:CLN were then determined by Eqs. (2) and (3), as presented in Fig. 3(c), wherein the sensitivities first increase, and then decrease with increasing temperature within the range of (70, 400) K. The maximal of is obtained at around 255 K, slightly lower than that of the orange and blue–green emission pair in Pr:YAG.
In order to explore the possibility for codopant to improve the performance of FIR-Ex thermometry mentioned before, we measured the normalized integrated intensities of red emission centered at 618 nm in Pr:Mg:CLN under 360 and 463 nm excitations. As shown in Fig. 3(b), the introduction of significantly enlarges the differences in fluorescence intensity as well as thermal attenuation behavior between emissions under 360 and 463 nm excitations. Fitted with Eqs. (4) and (5), is determined to be in Pr:Mg:CLN, while is evidently increased to . This can be explained by the shift of the IVCT state within the configurational coordinate diagram induced by codopant according to our previous study [18]. No increasing trend of emission intensity with increasing temperature is observed, indicating that the host sensitization under 360 nm excitation vanishes with incorporation. According to the lithium-vacancy model [18], large amounts of Nb-antisite defects distributing in Pr:CLN would be completely eliminated, while new defects and would be introduced upon 5 mol% doping. We therefore speculate that the vanishing host sensitization may be ascribed to the depletion of self-trapped excitons at low energies associated with the original types of sensitization centers, or the blocking of exciton migration by new defects before being trapped at .
The sensitivity of FIR-Ex thermometry in Pr:Mg:CLN is presented in Fig. 3(d). monotonically increases from 20 to 430 K with much higher value compared to that of Pr:CLN. The and , computed by Eqs. (2) and (3), based on the fitting curve of using Eq. (6), exhibit complicated temperature dependence. A wide optimum operating range from 70 to 430 K is attained with relatively high sensitivities and . The maximal in Pr:Mg:CLN based on the FIR-Ex strategy is at 338 K, significantly higher than those of other strategies mentioned above, including FIR-Ex in Pr:CLN and FIR-Em in Pr:YAG. This demonstrates the capability of codoping to substantially improve the performance of FIR-Ex thermometry.
In addition, we compared the in different thermometry strategies, as shown in Fig. 4(a). It can be observed that relatively high absolute sensitivity has been achieved based on the FIR-Ex method in Pr:Mg:CLN, compared with the results based on the FIR-Em method in various crystals. Impressively, the optimum sensing range of FIR-Ex strategies encompasses a wide scope of 70 to 430 K, while in FIR-Em strategy approaches at low temperatures. This unveils the potential of the FIR-Ex method to be applied at room temperature and relatively low temperature, overcoming the intrinsic restriction of the Boltzmann law in FIR-Em strategy. Such performance differences arise from the distinct underlying mechanisms to acquire the temperature-dependent emission contrast: thermal coupling between adjacent energy levels in FIR-Em, versus switching of charge/energy evolution paths in FIR-Ex. The extra freedom to tune the charge dynamics and the set of activation energies offer the intrinsic advantage of FIR-Ex strategy compared to FIR-Em strategy for optimizing the complicated temperature-dependent function [Eq. (6)].
Figure 4.(a) Comparison of absolute temperature sensitivities in different thermometry strategies, including FIR-Ex strategies: Pr:CLN (360 and 463 nm excitations) (this work); Pr:Mg:CLN (360 and 463 nm excitations) (this work); Pr:Mg:CLN#2 (280 and 463 nm excitations) (this work); and FIR-Em strategies: (Ref. [14]); (740 and 864 nm emissions) (Ref. [6]); (740 and 803 nm emissions) (Ref. [6]); (Ref. [4]); (Ref. [2]); Pr:YAG (Ref. [20]); (Ref. [21]); and Dy:YAG (Ref. [1]). As for absolute sensitivities of FIR-Em strategies, the solid line represents data reported in reference papers, while the dashed line represents fitting results based on the principle of FIR-Em scheme (See Data File 1). (b) Comparison of relative temperature sensitivities in different thermometry strategies. In the inset, the temperature dependences of normalized intensity of 618 nm red emission under 280 nm excitation (left vertical axis) and emission intensity ratio (right vertical axis) for Pr:Mg:CLN.
The comparison of in different thermometry strategies is shown in Fig. 4(b). Given the common derivation from population distribution of thermally coupled levels, the of various materials adopting the traditional FIR-Em strategies follows the same trend of temperature dependence, as represented by those of , , and . The of Pr:CLN and Pr:Mg:CLN based on fluorescence contrast driven by varying excitations at 360 and 463 nm in the 250–430 K range is slightly lower than those associated with FIR-Em strategies, which are sufficient for potential thermometry applications. When the temperature drops below 250 K, the of our system becomes much lower than those obtained with FIR-Em strategies. This can be explained by the sharp increase of towards infinity, with decreased temperature approaching 0 K for the FIR-Em strategies. Such tremendous at low temperatures, though, inevitably comes with vanishing FIR and according to the inherent mechanism. Consequentially, the difficulties in accurately measuring the ultrasmall emission intensity, which is related to one of the thermally coupled levels with higher energy, severely impede the application of FIR-Em thermometry at low temperatures. In comparison, the appropriate FIR of 0.28 to 0.63 (1.20 to 2.50) obtained in our Pr:CLN (Pr:Mg:CLN) samples in the temperature range of 70 to 430 K facilitates the precise spectral measurement and thus the application of FIR-Ex thermometry in a broad temperature range.
The thermal uncertainty [25,26], defining the accuracy that can be achieved in the temperature evaluation, could be extrapolated by the following formula: where is the relative uncertainty of thermometric parameter FIR; is determined by the optical acquisition system, and, in particular, depends on the signal-to-noise ratio of the obtained signal. The minimum thermal uncertainties were 1.48 K at 209 K and 1.34 K at 334 K for Pr:CLN and Pr:Mg:CLN, respectively, limited by the present measurement conditions. The minimum achievable thermal uncertainty was determined by the uncertainty of our optical acquisition system [27], on the order of . The could be significantly improved when decreasing in spectral measurement by refining the spectral acquisition.
We note that the FIR-Ex strategy proposed in this work still needs further improvement to compete with the state-of-the-art FIR-Em strategies. Luminescence materials with greater diversity in the thermal behaviors of two excitation bands should be investigated in future studies. While the FIR-Ex strategy is illustrated by the special IVCT process of , other doped systems with , emitting centers can also be employed in FIR-Ex thermometry via the design of different luminescence routes. In addition, host sensitization when effectively incorporated into the slower emission attenuation under UV excitation would greatly expand the difference between different luminescence routes and thus enhance the temperature sensitivity.
To illustrate the possibility of optimization within the FIR-Ex strategy, we attempted to improve the relative sensitivity of our Pr:Mg:CLN sample at temperature below 250 K, by replacing the 360 nm/463 nm excitations with the pair of 280 nm/463 nm while preserving the trace of 618 nm emission. The normalized emission intensity under 280 nm excitation exhibits an abnormal rise at temperatures ranging from 130 to 250 K, as presented in the inset of Fig. 4(b), which can be attributed to the host sensitization with energy transferred from excited host to dopant. Such modification of charge dynamics results in a monotonic increase of FIR between the red emissions excited at 280 and 463 nm from 130 to 370 K, as presented in the inset of Fig. 4(b). The corresponding and were calculated and incorporated into Figs. 4(a) and 4(b) and labeled as Pr:Mg:CLN#2. Significant improvement of is achieved with the maximum value of obtained at around 207 K, demonstrating the feasibility of introducing an additional energy transfer process to increase the contrast between relevant charge/energy evolution routes. Quantitative analysis on the impact of host sensitization is beyond the scope of this work, but deserves our in-depth exploration in the future.
4. CONCLUSIONS
In conclusion, we have developed a novel FIR-Ex strategy for optical thermometry based on the diversity in thermal attenuation of two emissions at the same peak while being stimulated at different excitation wavelengths. Compared to traditional FIR-Em strategy, which relies on the Boltzmann distribution between thermally coupled levels, the proposed FIR-Ex strategy harnesses the temperature-dependent fluorescence contrast stemming from different charge/energy evolution routes, and thus provides greater flexibility for optimizing sensitivity in a broad temperature range. The potential of the FIR-Ex thermometer was demonstrated by investigating the distinct temperature dependences of red emission in Pr:Mg:CLN under 360 and 463 nm excitations. Relatively high temperature sensitivity was achieved in a broad temperature range of 70–430 K, with the maximal of . The substantial improvement by incorporation suggests that the performance of the FIR-Ex thermometer can be optimized via simple approaches such as codoping. Given their distinct sensing mechanisms, the FIR-Ex strategy has the potential to be considered in parallel with the traditional FIR-Em strategy in order to design the optimized thermometer, especially at room temperature and relatively low temperature scopes.