
Jing Liu, Flavia Artizzu, Min Zeng, Luca Pilia, Pieter Geiregat, Rik Van Deun. Dye-sensitized Er3+-doped CaF2 nanoparticles for enhanced near-infrared emission at 1.5 μm[J]. Photonics Research, 2021, 9(10): 2037
- Photonics Research
- Vol. 9, Issue 10, 2037 (2021)
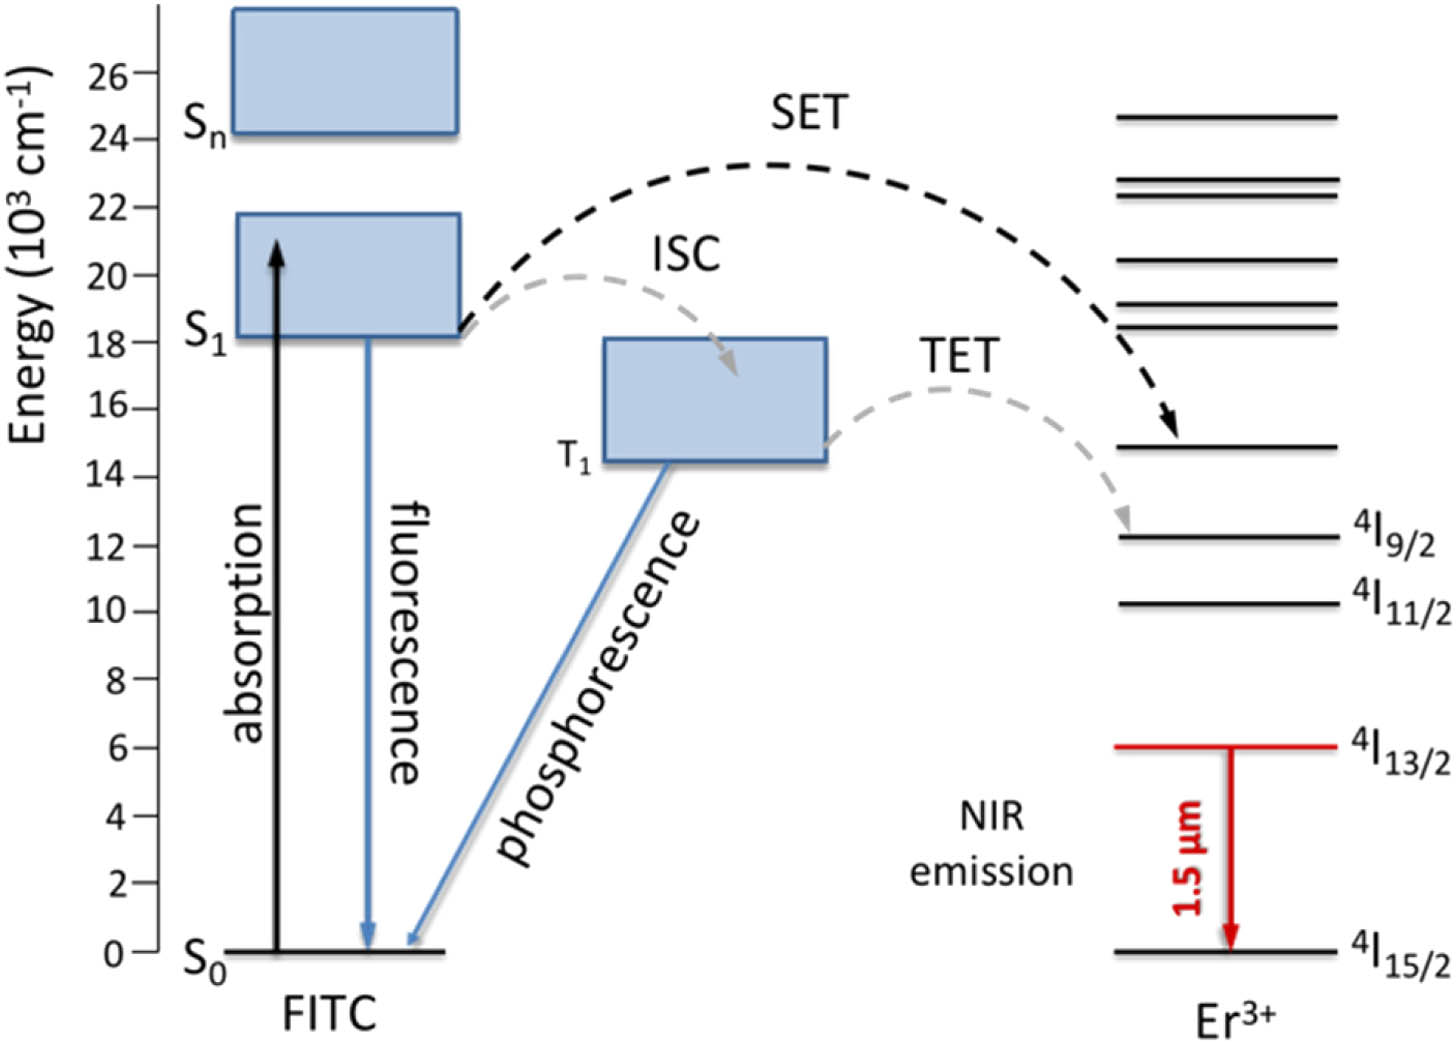
Fig. 1. Mechanism of ET in FITC sensitized Er 3 + CaF 2
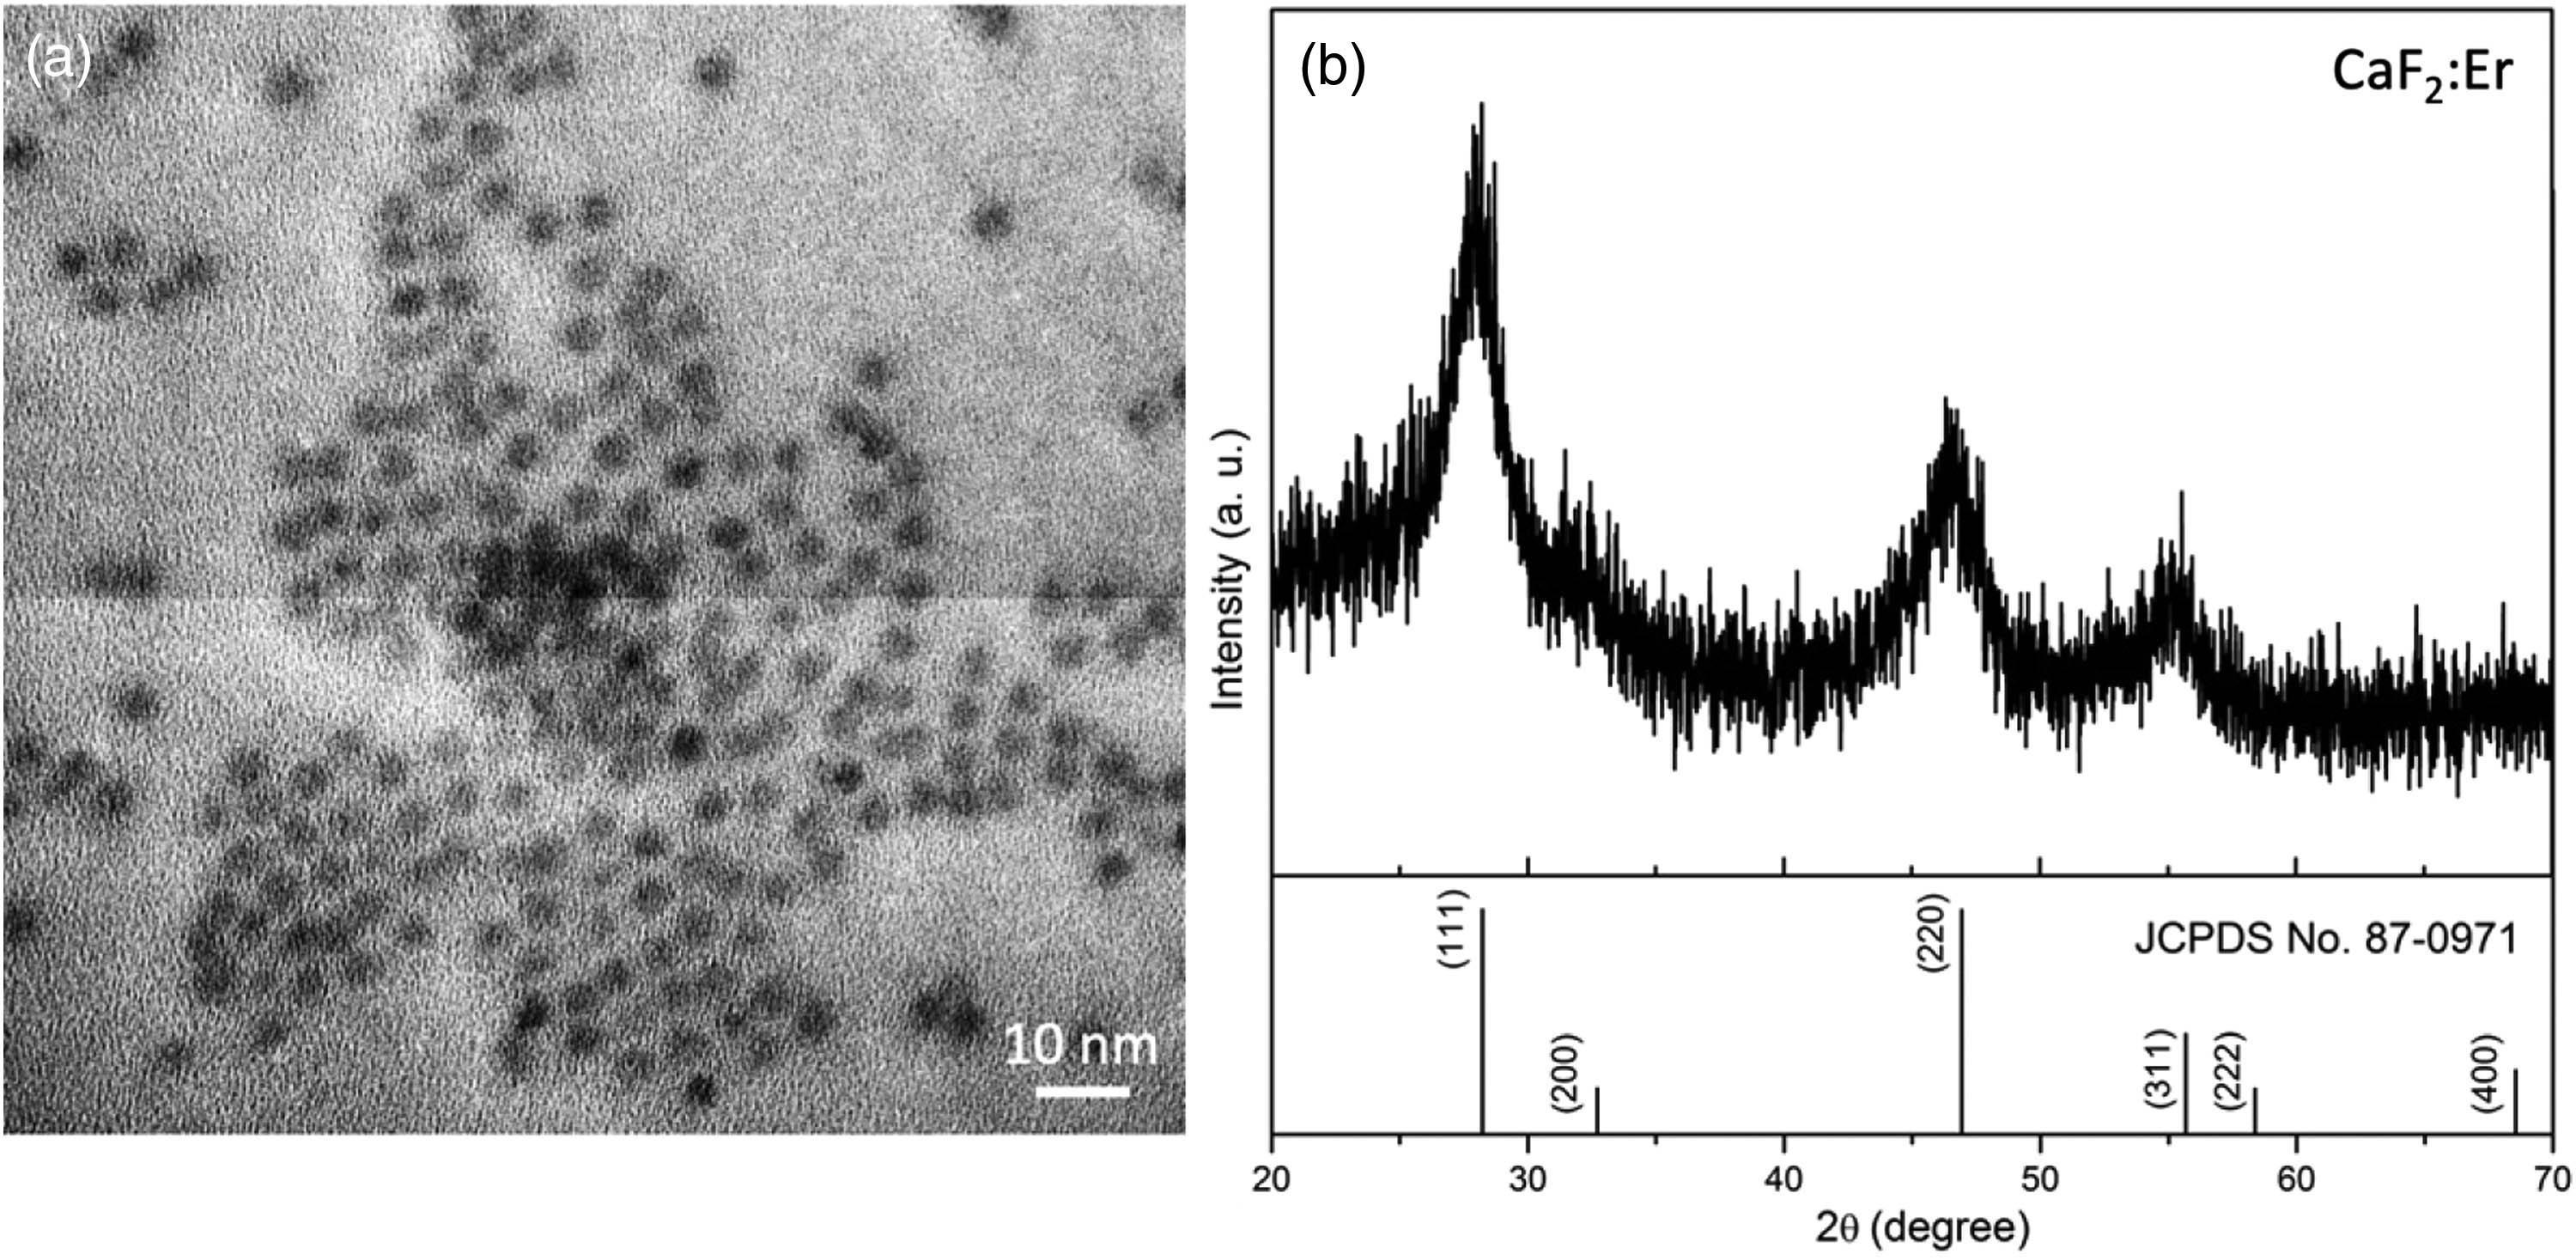
Fig. 2. (a) TEM image and (b) powder XRD pattern of CaF 2 : Er 3 +
Fig. 3. (a) Absorption spectra; (b) Vis emission spectra (λ ex = 467 nm λ ex = 467 nm λ em = 538 nm CaF 2 @ FITC CaF 2 : Er 3 + @ FITC
Fig. 4. (a) Optimized geometries and (b) MOs calculated by DFT methods at B3LYP/6-311 + G(d,p) level of theory (color codes: Ca, green; C, gray; O, red; N, purple; S, yellow; H, white). The orbitals are reported with a contour value of 0.050.
Fig. 5. (a) NIR emission spectra of CaF 2 : Er 3 + λ ex = 378 nm Er 3 + 4 G 11 / 2 ← 4 I 15 / 2 CaF 2 : Er 3 + @ FITC λ ex = 467 nm CaF 2 : Er 3 + λ ex = 378 nm λ em = 1530 nm CaF 2 : Er 3 + @ FITC λ ex = 467 nm λ em = 1530 nm
Fig. 6. Two-dimensional (2D) TA (Δ A CaF 2 @ FITC CaF 2 : Er 3 + @ FITC CaF 2 : Er 3 + @ FITC CaF 2 @ FITC CaF 2 : Er 3 + @ FITC CaF 2 @ FITC CaF 2 : Er 3 + @ FITC
Fig. 7. (a) Spectral overlap of Er 3 + Er 3 + η sens R ). Inset, DFT-calculated optimized geometry for FITC coordinated to Ca 2 + S 1 − S 0
|
Table 1. FITC-Excited Singlet Ultrafast Decay Time Constants and FITC to Er3+ Sensitization Efficiency Calculated through Eq. (1 )

Set citation alerts for the article
Please enter your email address
© Copyright 2018-2021 | Chinese Laser Press. All Rights Reserved 沪ICP备15018463号-20